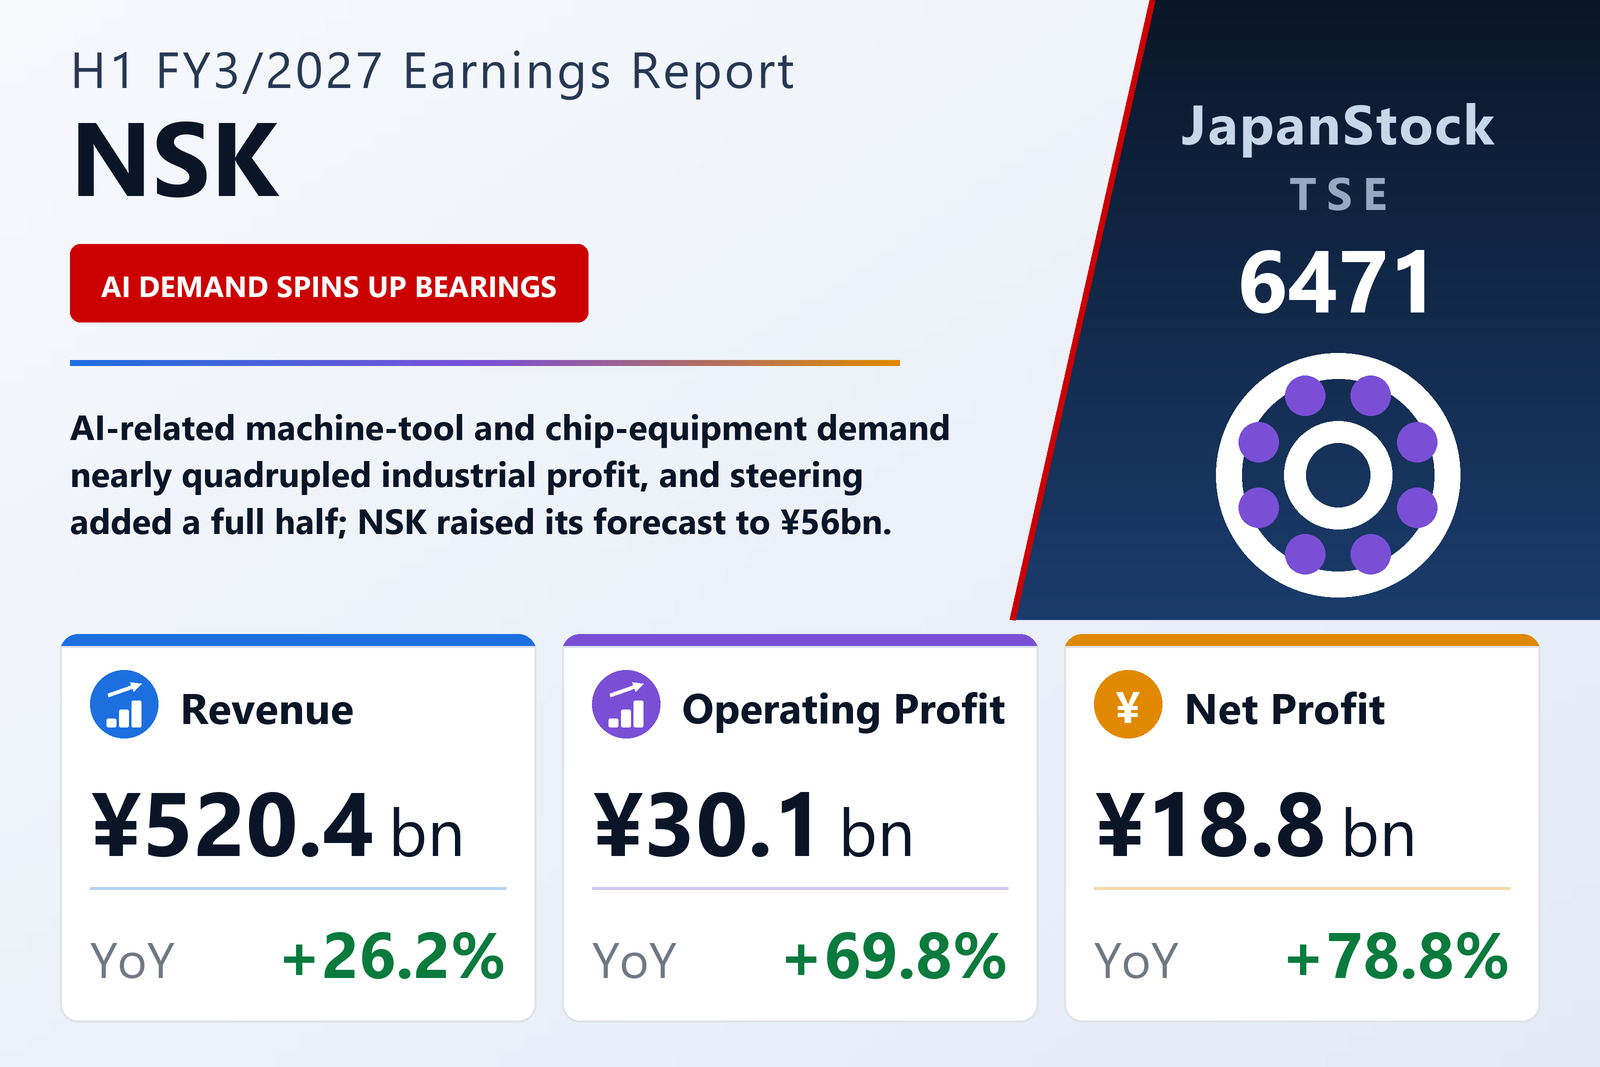
AI investment powers industrial machinery
NSK Ltd. (TSE: 6471) reported consolidated IFRS results for the first half of FY3/2027, April 1 to September 30, 2026, on October 29, 2026. Growing AI-related investment raised demand from machine-tool and semiconductor-equipment makers, lifting Industrial Machinery revenue 18.6% to ¥214,461 million and its operating profit 278.4% to ¥18,478 million; sales grew in Japan, the Americas, Europe and China. Automotive revenue was flat at ¥201,136 million, with weak sales in Japan, Europe and China offset by a weaker yen and higher sales of ball screws for electric brakes in China, and its operating profit rose 3.0% to ¥9,127 million. Steering, which NSK consolidated after buying NSK Steering & Control from Japan Industrial Solutions' fund on September 1, 2025, contributed revenue of ¥88,690 million and operating profit of ¥3,068 million, against ¥15,184 million and ¥4,255 million for the one month included a year earlier. Basic earnings per share were ¥38.48 against ¥21.55.
Forecast raised, dividend unchanged
Total assets rose 3.2% to ¥1,279,413 million and the owners' equity ratio was 54.0% against 54.2%. Operating cash flow was ¥45,176 million against ¥55,108 million, and investing outflows fell to ¥42,910 million from ¥91,439 million. NSK raised its FY3/2027 forecast to revenue of ¥1,050,000 million (+15.2%) from ¥1,040,000 million, operating profit of ¥56,000 million (+44.3%), pre-tax profit of ¥53,500 million (+40.6%) and profit attributable to owners of ¥34,000 million (+48.7%) from ¥29,000 million, for earnings per share of ¥69.42. The annual dividend stays at ¥34, including ¥17 at the half year.
| Metric | H1 FY3/2027 | H1 FY3/2026 | Change |
|---|---|---|---|
| Revenue (¥ million) | 520,351 | 412,250 | +26.2% |
| Operating profit (¥ million) | 30,066 | 17,708 | +69.8% |
| Pre-tax profit (¥ million) | 28,909 | 17,303 | +67.1% |
| Net profit attrib. to owners of parent (¥ million) | 18,838 | 10,537 | +78.8% |
| Comprehensive income (¥ million) | 27,822 | 20,856 | +33.4% |
| EPS (¥) | 38.48 | 21.55 | +78.6% |
| Total assets (¥ million) | 1,279,413 | 1,239,769 | +3.2% |
| Equity attrib. to owners of parent (¥ million) | 690,404 | 671,975 | +2.7% |
| Equity ratio | 54.0% | 54.2% | -0.2 pt |
| FY3/2027 guidance — revenue (¥ million) | 1,050,000 | — | +15.2% |
| FY3/2027 guidance — operating profit (¥ million) | 56,000 | — | +44.3% |
| FY3/2027 guidance — pre-tax profit (¥ million) | 53,500 | — | +40.6% |
| FY3/2027 guidance — net profit (¥ million) | 34,000 | — | +48.7% |
| Annual dividend per share (¥) | 34.00 | 34.00 | unchanged |
JapanStockPulse provides informational content only and does not constitute investment advice. Figures are taken from the company's published earnings short report and may be subject to subsequent revision.