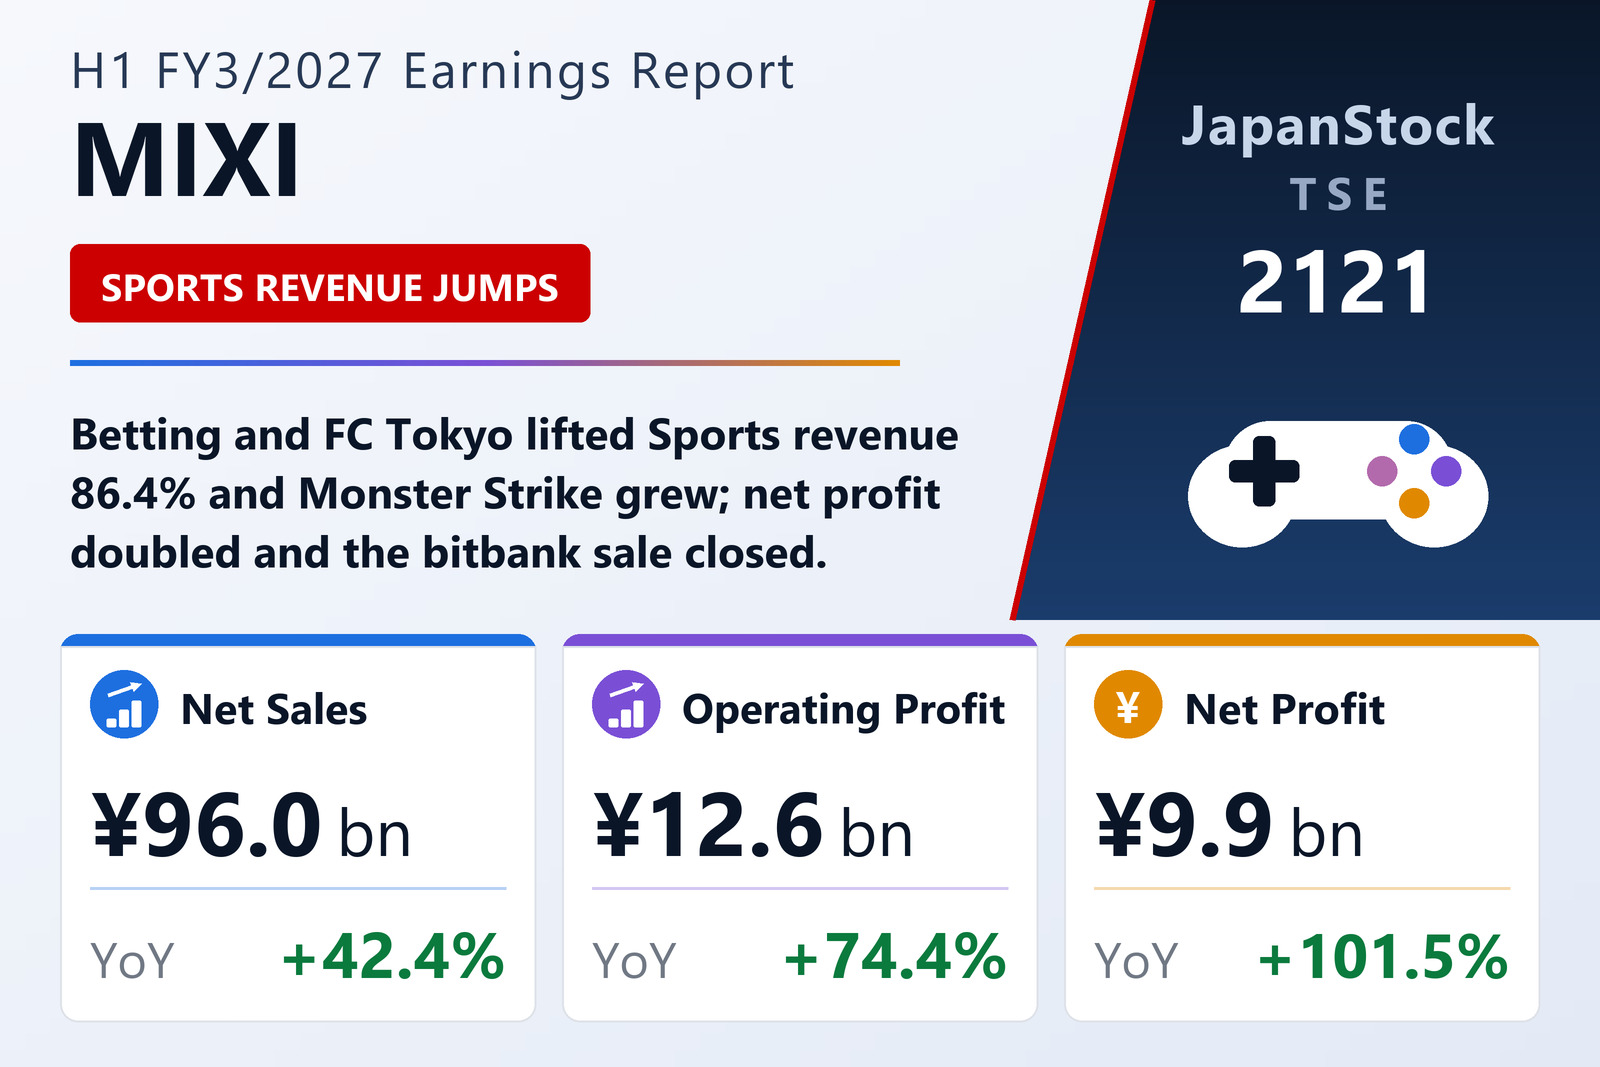
Betting and FC Tokyo power Sports
MIXI, Inc. (TSE: 2121) reported consolidated results for the first half of FY3/2027, April 1 to September 30, 2026, on October 30, 2026 under Japanese GAAP. Segment profit is measured on an EBITDA basis. Sports revenue rose 86.4% to ¥40,972 million and segment profit 520.8% to ¥2,739 million, helped by the consolidation of PointsBet Holdings from last September, strong velodrome operations at Chari-Loto and higher keirin ticket sales at Netdreamers; FC Tokyo transfer fees and ticket sales at FC Tokyo and the Chiba Jets also rose. FC Tokyo's change of fiscal year meant eight months of its results, February to September, were consolidated. Digital Entertainment revenue rose 22.2% to ¥43,603 million and segment profit 47.1% to ¥24,371 million, as higher ARPU at Monster Strike outweighed fewer monthly active users and cost efficiencies helped. Lifestyle revenue rose 18.8% to ¥8,430 million with a ¥905 million segment profit.
bitbank gain due in Q3; forecast held
Operating profit rose 74.4% to ¥12,582 million and ordinary profit 67.3% to ¥12,070 million; net profit of ¥9,878 million equals ¥151.53 per share against ¥72.91. As a subsequent event, MIXI completed the sale of all its shares in crypto-asset exchange operator bitbank on October 1 for ¥15,590 million and expects to book a ¥12,581 million gain on investment securities in the third quarter. It kept its FY3/2027 forecast of net sales of ¥185,000 million (+8.0%), EBITDA of ¥31,500 million, operating profit of ¥19,500 million (−12.4%) and net profit of ¥25,000 million (+44.8%), and its annual dividend plan of ¥155 against ¥120. Total assets were ¥294,609 million and the equity ratio was 65.0%.
| Metric | H1 FY3/2027 | H1 FY3/2026 | Change |
|---|---|---|---|
| Net sales (¥ million) | 96,020 | 67,428 | +42.4% |
| EBITDA (¥ million) | 19,005 | 9,588 | +98.2% |
| Operating profit (¥ million) | 12,582 | 7,214 | +74.4% |
| Ordinary profit (¥ million) | 12,070 | 7,215 | +67.3% |
| Net profit attrib. to owners of parent (¥ million) | 9,878 | 4,902 | +101.5% |
| Comprehensive income (¥ million) | 8,916 | 5,164 | +72.6% |
| EPS (¥) | 151.53 | 72.91 | +107.8% |
| Digital Entertainment — revenue (¥ million) | 43,603 | 35,692 | +22.2% |
| Digital Entertainment — segment profit (¥ million) | 24,371 | 16,571 | +47.1% |
| Sports — revenue (¥ million) | 40,972 | 21,977 | +86.4% |
| Sports — segment profit (¥ million) | 2,739 | 441 | +520.8% |
| Lifestyle — revenue (¥ million) | 8,430 | 7,094 | +18.8% |
| Lifestyle — segment profit (¥ million) | 905 | — | loss to profit |
| Total assets (¥ million) | 294,609 | 280,405 | +5.1% |
| Net assets (¥ million) | 199,770 | 189,466 | +5.4% |
| Equity ratio | 65.0% | 64.7% | +0.3 pt |
| FY3/2027 guidance — revenue (¥ million) | 185,000 | — | +8.0% |
| FY3/2027 guidance — EBITDA (¥ million) | 31,500 | — | +1.0% |
| FY3/2027 guidance — operating profit (¥ million) | 19,500 | — | -12.4% |
| FY3/2027 guidance — ordinary profit (¥ million) | 20,000 | — | -19.0% |
| FY3/2027 guidance — net profit (¥ million) | 25,000 | — | +44.8% |
| Annual dividend per share (¥) | 155.00 | 120.00 | +29.2% |
JapanStockPulse provides informational content only and does not constitute investment advice. Figures are taken from the company's published earnings short report and may be subject to subsequent revision.