A stronger second quarter, but costs rose
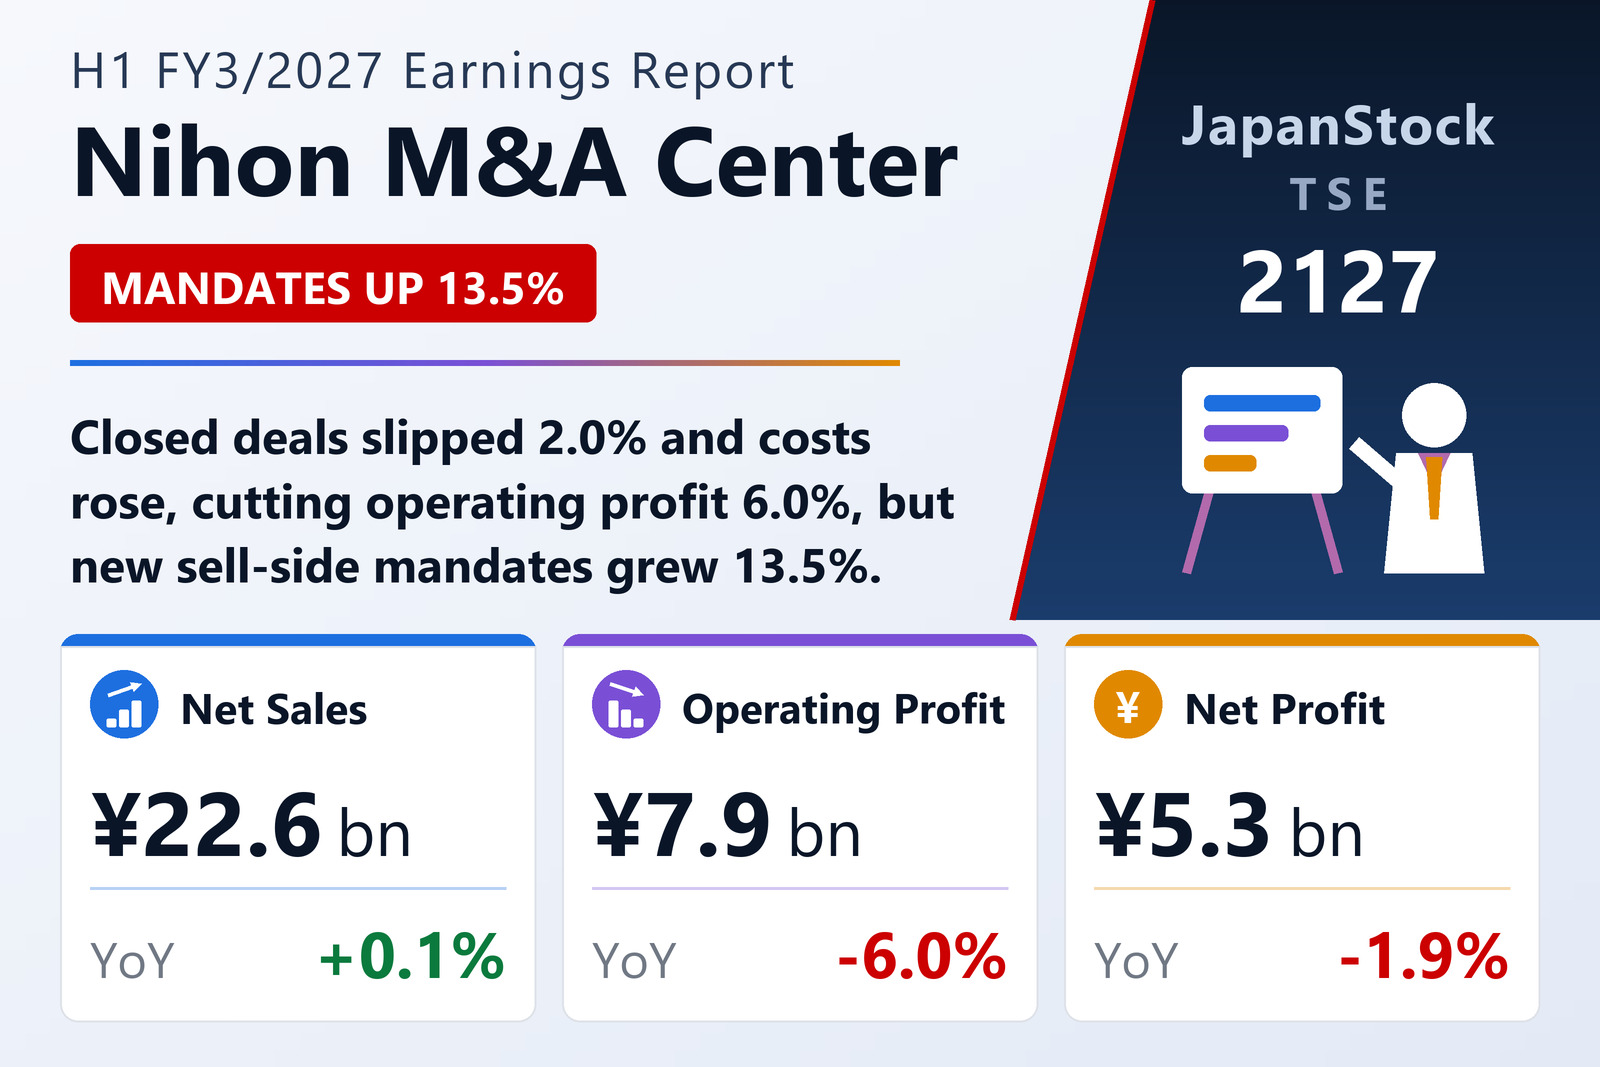
Nihon M&A Center Holdings Inc. (TSE: 2127) reported consolidated results for the first half of FY3/2027, April 1 to September 30, 2026, on October 30, 2026 under Japanese GAAP. Closed deals reached 290 in the July–September quarter, up 5.1% and well above 188 in the first quarter, but 478 for the half, down 2.0%. Large deals with success fees of ¥100 million or more rose 15.2% to 53, and revenue per deal edged up 2.2% to ¥45.6 million. Cost of sales fell 1.2% to ¥8,494 million on lower referral and outsourcing fees, but SG&A rose 11.1% to ¥6,208 million on advertising for the company's 35th anniversary and IT spending, so operating profit fell 6.0% to ¥7,896 million and ordinary profit 8.0% to ¥7,884 million. Results came in below the company's own half-year plan: 94.6% of planned sales and 91.8% of planned operating profit.
Pipeline builds; guidance and dividend held
Leading indicators improved: new sell-side mandates rose 13.5% to 699, including 155 from mid-cap companies, up 30.3%, and the number of deals in negotiation at the end of September was about 22% higher than a year earlier. Extraordinary gains of ¥790 million, mainly a ¥735 million gain on the sale of affiliate shares, limited the fall in net profit to 1.9%, at ¥5,305 million or ¥16.72 per share. The company kept its FY3/2027 forecast of net sales of ¥52,800 million (+5.1%), operating profit of ¥19,300 million (+2.9%) and net profit of ¥13,400 million (+7.3%). It pays an interim dividend of ¥14, including a ¥2 special dividend, and plans an annual ¥29. Total assets fell to ¥60,860 million and the equity ratio rose to 83.9%.
| Metric | H1 FY3/2027 | H1 FY3/2026 | Change |
|---|---|---|---|
| Net sales (¥ million) | 22,599 | 22,587 | +0.1% |
| Operating profit (¥ million) | 7,896 | 8,399 | -6.0% |
| Ordinary profit (¥ million) | 7,884 | 8,571 | -8.0% |
| Net profit attrib. to owners of parent (¥ million) | 5,305 | 5,410 | -1.9% |
| Comprehensive income (¥ million) | 5,695 | 5,376 | +5.9% |
| EPS (¥) | 16.72 | 17.05 | -1.9% |
| Total assets (¥ million) | 60,860 | 66,223 | -8.1% |
| Net assets (¥ million) | 51,278 | 50,643 | +1.3% |
| Equity ratio | 83.9% | 75.8% | +8.1 pt |
| FY3/2027 guidance — revenue (¥ million) | 52,800 | — | +5.1% |
| FY3/2027 guidance — operating profit (¥ million) | 19,300 | — | +2.9% |
| FY3/2027 guidance — ordinary profit (¥ million) | 19,300 | — | +0.8% |
| FY3/2027 guidance — net profit (¥ million) | 13,400 | — | +7.3% |
| Annual dividend per share (¥) | 29.00 | 29.00 | unchanged |
JapanStockPulse provides informational content only and does not constitute investment advice. Figures are taken from the company's published earnings short report and may be subject to subsequent revision.