Volumes up, margins thinner
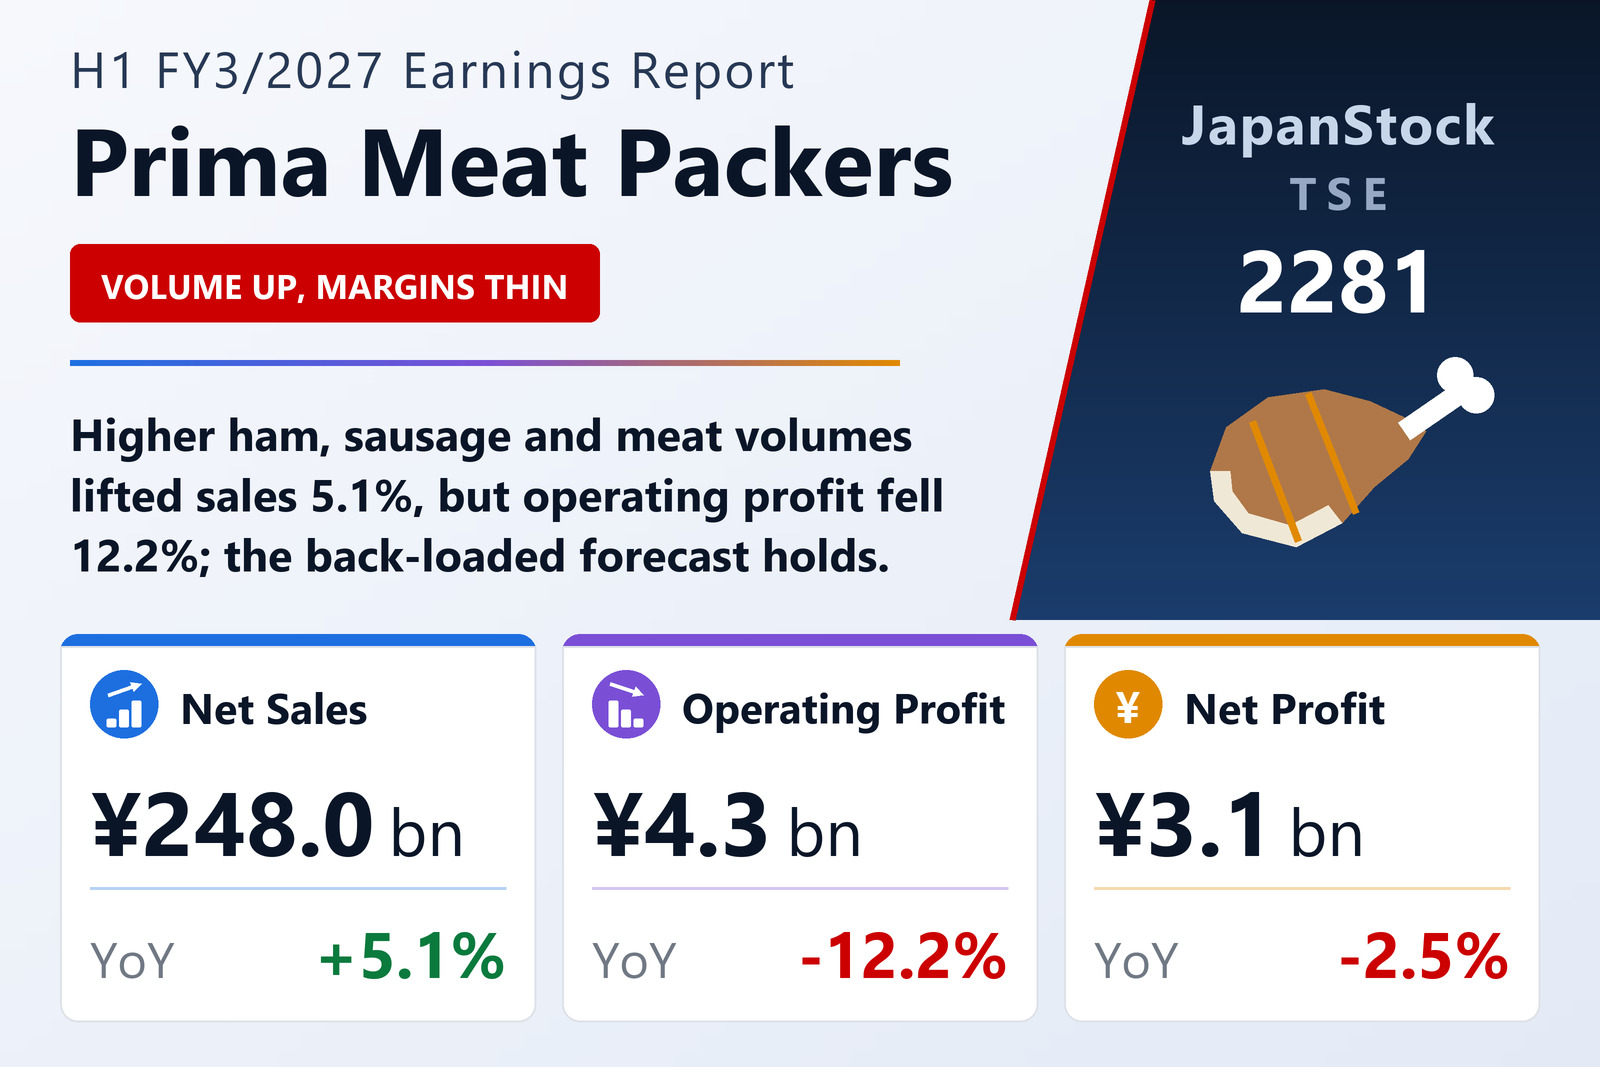
Prima Meat Packers, Ltd. (TSE: 2281) reported consolidated results for the first half of FY3/2027, April 1 to September 30, 2026, on October 30, 2026 under Japanese GAAP. Sales rose on higher volumes of ham and sausage, processed foods and meat: ham and sausage sales grew 3.8% to ¥64,798 million and meat 10.8% to ¥93,754 million, while processed foods were flat at ¥87,767 million. By segment, Processed foods revenue rose 2.6% to ¥161,673 million with profit almost unchanged at ¥4,468 million, and Meat revenue rose 9.9% to ¥85,624 million while its profit fell 26.1% to ¥440 million. Corporate costs not allocated to segments rose to ¥726 million from ¥276 million, which accounts for most of the decline in operating profit to ¥4,309 million.
Guidance and dividend unchanged
Ordinary profit fell 15.8% to ¥4,708 million, and net profit slipped 2.5% to ¥3,073 million, or ¥61.14 per share. The company kept its FY3/2027 forecast of net sales of ¥500,000 million (+5.1%), operating profit of ¥11,000 million (+20.5%), ordinary profit of ¥12,000 million and net profit of ¥7,500 million (+63.5%), which leaves about ¥6.7 billion of operating profit to be earned in the second half. It plans an annual dividend of ¥80, unchanged, with ¥40 paid at the interim. Total assets rose to ¥248,592 million on higher inventories and deposits, and the equity ratio was 49.3%.
| Metric | H1 FY3/2027 | H1 FY3/2026 | Change |
|---|---|---|---|
| Net sales (¥ million) | 247,999 | 236,059 | +5.1% |
| Operating profit (¥ million) | 4,309 | 4,910 | -12.2% |
| Ordinary profit (¥ million) | 4,708 | 5,594 | -15.8% |
| Net profit attrib. to owners of parent (¥ million) | 3,073 | 3,150 | -2.5% |
| Comprehensive income (¥ million) | 2,781 | 3,460 | -19.6% |
| EPS (¥) | 61.14 | 62.68 | -2.5% |
| Processed foods — revenue (¥ million) | 161,673 | 157,500 | +2.6% |
| Processed foods — segment profit (¥ million) | 4,468 | 4,483 | -0.3% |
| Meat — revenue (¥ million) | 85,624 | 77,939 | +9.9% |
| Meat — segment profit (¥ million) | 440 | 595 | -26.1% |
| Total assets (¥ million) | 248,592 | 241,280 | +3.0% |
| Net assets (¥ million) | 131,382 | 130,536 | +0.6% |
| Equity ratio | 49.3% | 50.5% | -1.2 pt |
| FY3/2027 guidance — revenue (¥ million) | 500,000 | — | +5.1% |
| FY3/2027 guidance — operating profit (¥ million) | 11,000 | — | +20.5% |
| FY3/2027 guidance — ordinary profit (¥ million) | 12,000 | — | +7.3% |
| FY3/2027 guidance — net profit (¥ million) | 7,500 | — | +63.5% |
| Annual dividend per share (¥) | 80.00 | 80.00 | unchanged |
JapanStockPulse provides informational content only and does not constitute investment advice. Figures are taken from the company's published earnings short report and may be subject to subsequent revision.