AI datacenter demand lifts every application
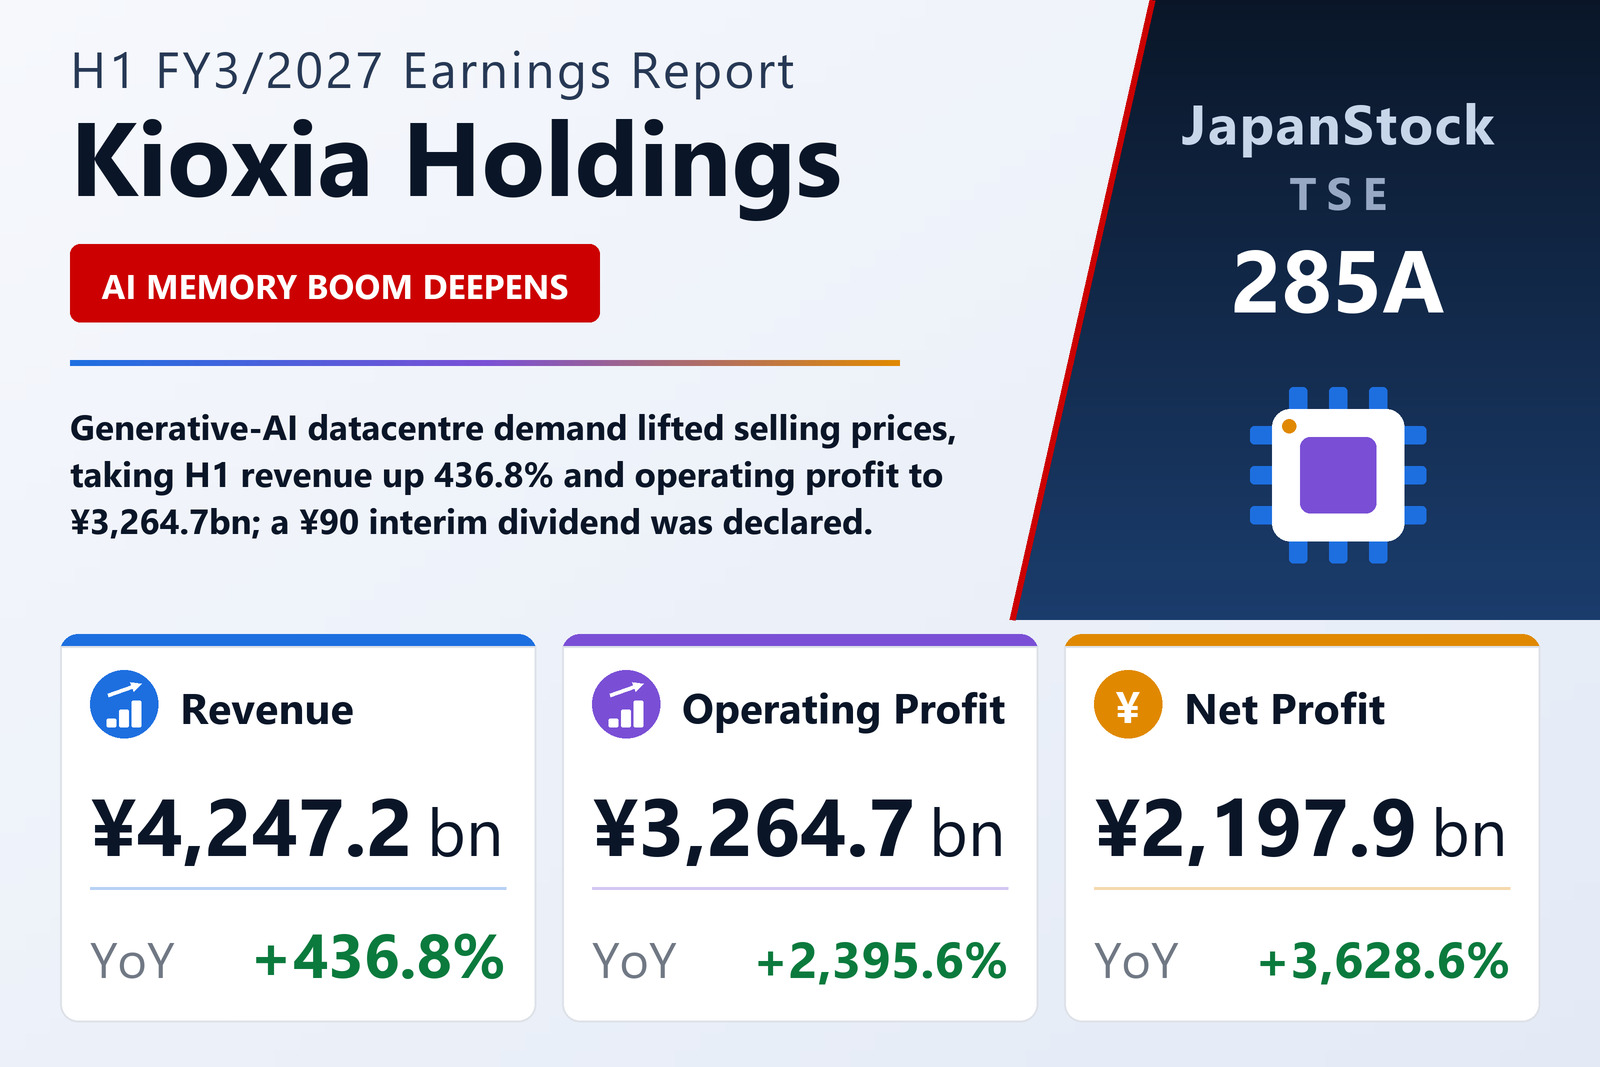
Kioxia Holdings Corporation (TSE: 285A) reported consolidated IFRS results for the first half of FY3/2027, April 1 to September 30, 2026, on October 30, 2026. Revenue rose 436.8% to ¥4,247.2 billion from ¥791.1 billion, which the company attributed to strong demand from datacenter customers centred on generative-AI applications, a sharp rise in average selling prices, higher bit shipments and a weaker yen: the average dollar rate was ¥160 against ¥146 a year earlier. By application, SSD & Storage revenue reached ¥2,790.7 billion against ¥462.0 billion, Smart Devices ¥1,314.5 billion against ¥236.3 billion and Other ¥141.9 billion against ¥92.8 billion. Kioxia said smartphone and PC demand was slowing while demand for AI servers kept the market expanding. Gross profit rose to ¥3,433.2 billion, for a gross margin of 80.8% against 24.4%, and the operating margin reached 76.9% against 16.5%. Operating profit absorbed a ¥36.6 billion litigation provision, a special profit-sharing payment to employees and ¥13.0 billion of share-based compensation; excluding such items, Non-GAAP operating profit was ¥3,314.5 billion. Profit before tax was ¥3,203.4 billion and basic earnings per share ¥1,349.33 against ¥36.42, both restated for the three-for-one stock split that took effect on October 1, 2026.
Second quarter beats the company's own guidance
In the second quarter alone, July to September, revenue rose ¥712.9 billion from the first quarter to ¥2,480.0 billion, ahead of the ¥2,390.0 billion Kioxia had guided in July; SSD & Storage contributed ¥1,616.0 billion and Smart Devices ¥788.9 billion. Operating profit was ¥1,994.7 billion against ¥1,270.0 billion in the first quarter and guidance of ¥1,890.0 billion, helped by the absence of a litigation charge and a ¥6.4 billion reversal of share-based compensation. Profit attributable to owners of the parent was ¥1,355.7 billion against guidance of ¥1,270.0 billion.
Flat third quarter, first dividend and ¥800 billion buyback
Kioxia does not publish a full-year plan and guides one quarter at a time. For October to December it expects revenue of ¥2,500.0 billion, up 0.8% on the second quarter, operating profit of ¥1,995.0 billion, Non-GAAP operating profit of ¥2,000.0 billion and profit attributable to owners of ¥1,360.0 billion, for basic earnings per share of ¥851.11: datacenter demand is expected to stay strong, but the company assumes a less favourable dollar rate of ¥157 against ¥161. Cumulative nine-month revenue would be ¥6,747.2 billion, up 405.5%. Having paid no dividend for FY3/2026, Kioxia revised its dividend forecast and declared an interim dividend of ¥90 per share, stated before the stock split, payable from December 8; it gave no year-end forecast. It bought back ¥800.0 billion of its own shares and repaid ¥523.1 billion of long-term borrowings, partly ahead of schedule. Operating cash flow reached ¥2,379.6 billion against ¥175.2 billion and cash rose ¥926.6 billion to ¥1,397.3 billion. Total assets grew to ¥5,883.9 billion from ¥3,690.1 billion and the owners' equity ratio improved to 49.8% from 37.9%.
| Metric | H1 FY3/2027 | H1 FY3/2026 | Change |
|---|---|---|---|
| Revenue (¥ million) | 4,247,152 | 791,145 | +436.8% |
| SSD & Storage — revenue (¥ million) | 2,790,716 | 461,970 | +504.1% |
| Smart Devices — revenue (¥ million) | 1,314,513 | 236,340 | +456.2% |
| Other — revenue (¥ million) | 141,923 | 92,835 | +52.9% |
| Gross profit (¥ million) | 3,433,229 | 193,317 | +1,676.0% |
| Gross margin | 80.8% | 24.4% | +56.4 pt |
| Non-GAAP operating profit (¥ million) | 3,314,530 | 132,377 | +2,403.9% |
| Operating profit (¥ million) | 3,264,727 | 130,820 | +2,395.6% |
| Operating margin | 76.9% | 16.5% | +60.4 pt |
| Pre-tax profit (¥ million) | 3,203,390 | 84,010 | +3,713.1% |
| Net profit attrib. to owners of parent (¥ million) | 2,197,871 | 58,946 | +3,628.6% |
| Non-GAAP net profit attrib. to owners of parent (¥ million) | 2,235,582 | 60,172 | +3,615.3% |
| Comprehensive income (¥ million) | 2,324,726 | 80,298 | +2,795.1% |
| EPS (¥) | 1,349.33 | 36.42 | +3,604.9% |
| Q2 (Jul–Sep) revenue (¥ million) | 2,480,035 | 448,346 | +453.2% |
| Q2 (Jul–Sep) operating profit (¥ million) | 1,994,710 | 85,921 | +2,221.6% |
| Total assets (¥ million) | 5,883,885 | 3,690,071 | +59.5% |
| Equity attrib. to owners of parent (¥ million) | 2,928,964 | 1,398,929 | +109.4% |
| Equity ratio | 49.8% | 37.9% | +11.9 pt |
| Q3 (Oct–Dec) revenue guidance (¥ million), vs Q2 actual | 2,500,000 | 2,480,035 | +0.8% |
| Q3 (Oct–Dec) operating profit guidance (¥ million), vs Q2 actual | 1,995,000 | 1,994,710 | +0.0% |
| Q3 (Oct–Dec) net profit attrib. to owners guidance (¥ million), vs Q2 actual | 1,360,000 | 1,355,706 | +0.3% |
| Interim dividend (¥, pre-split basis) | 90.00 | 0.00 | new |
JapanStockPulse provides informational content only and does not constitute investment advice. Figures are taken from the company's published earnings short report and may be subject to subsequent revision.