Price pass-through and volume widen the margin
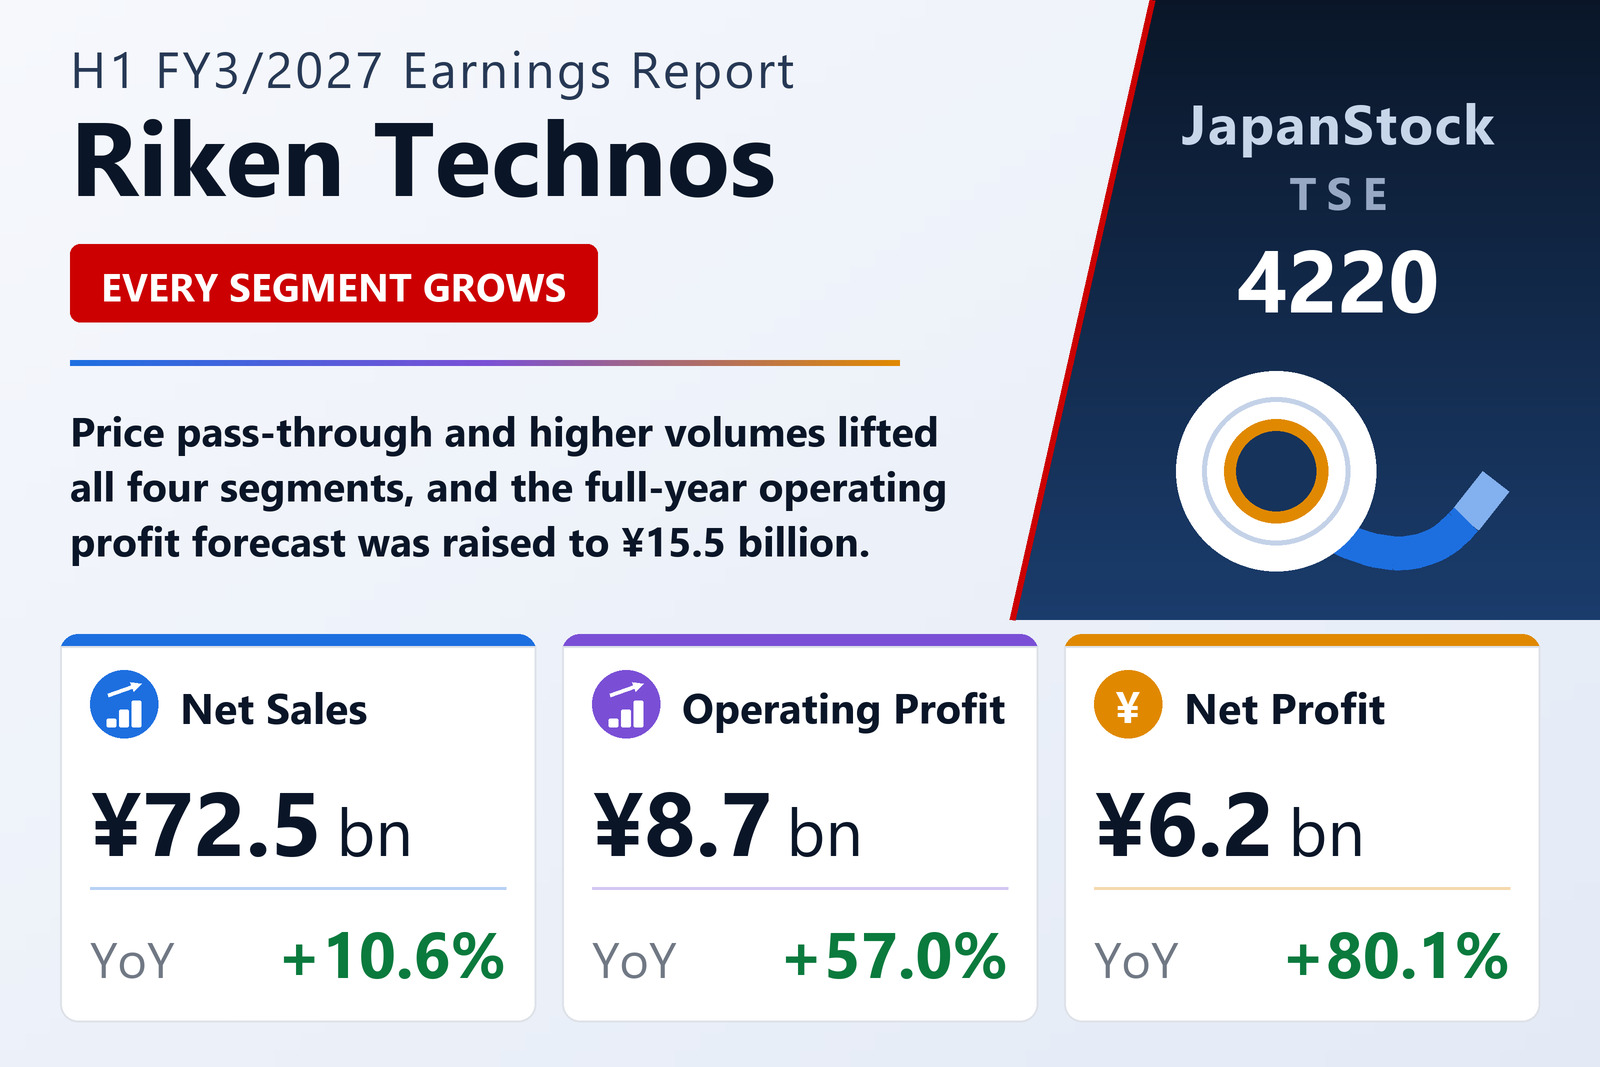
Riken Technos Corporation (TSE: 4220), the Japanese maker of PVC and non-PVC compounds, films and food-packaging wrap, reported consolidated results for the first half of FY3/2027, April 1 to September 30, 2026, on October 30, 2026 under Japanese GAAP. Net sales rose 10.6% to ¥72,509 million while cost of sales grew 6.2%, so gross profit climbed 29.0% to ¥16,272 million and the gross margin widened from 19.2% to 22.4%. Selling, general and administrative expenses rose 7.1% to ¥7,584 million, and operating profit grew 57.0% to ¥8,688 million, a margin of 12.0% against 8.4%. Ordinary profit rose 57.9% to ¥8,663 million. A ¥1,400 million gain on the sale of investment securities lifted pre-tax profit 76.9% to ¥10,061 million, and profit attributable to owners of the parent rose 80.1% to ¥6,233 million. Earnings per share were ¥133.01 against ¥68.63, up 93.8%, helped by a 7.1% fall in the average number of shares outstanding.
Every segment grows profit faster than revenue
Transportation grew revenue 10.2% to ¥23,249 million and segment profit 32.5% to ¥2,909 million: in Japan, compound sales fell on temporary auto production halts and lower exports to China, but passing on higher raw-material costs lifted revenue, while compound sales rose at the ASEAN sites. Daily Life & Healthcare grew revenue 8.3% to ¥19,954 million and profit 51.9% to ¥2,974 million, the largest of any segment, on higher sales of food-packaging wrap and price optimisation for compounds at home and abroad. Electronics grew revenue 16.6% to ¥14,937 million and profit 130.5% to ¥1,863 million, driven by compounds for the wire and cable market in Japan and higher PVC compound sales in Thailand and China. Building & Construction grew revenue 8.5% to ¥14,362 million and profit 71.4% to ¥912 million on higher sales of compounds and building-material films and price optimisation. Management described a gradually recovering Japanese economy against uncertainty from China's slowdown, the Middle East and financial markets, in the second year of its 'One Vision, New Stage 2027' medium-term plan.
Forecast and dividend raised, buyback more than half done
Riken Technos raised its FY3/2027 forecast, citing recent performance: net sales to ¥145,500 million (+10.7%) from ¥145,000 million, operating profit to ¥15,500 million (+35.9%) from ¥14,500 million, ordinary profit to ¥15,400 million (+30.7%) from ¥14,500 million and net profit to ¥10,000 million (+32.1%) from ¥9,500 million, or ¥221.04 per share. First-half operating profit beat the ¥7,900 million forecast issued in July, yet the new forecast still implies second-half operating profit of about ¥6,812 million, below the first half. The company will pay an interim dividend of ¥42 on November 30 and raised its year-end forecast to ¥47 from ¥43, for an annual ¥89 against ¥54 for FY3/2026. Under the buyback approved on July 31, it acquired 2.11 million shares for ¥5,145 million during the period, against a ceiling of 4,000,000 shares and ¥8,800 million. Treasury stock rose to ¥10,586 million, and net assets fell 2.6% to ¥76,416 million even as total assets rose 3.9% to ¥123,741 million; the equity ratio fell from 56.8% to 52.8%. Operating cash flow was ¥7,582 million, and cash and cash equivalents fell ¥2,113 million to ¥24,414 million after ¥6,454 million of treasury-share purchases and ¥2,691 million of dividends.
| Metric | H1 FY3/2027 | H1 FY3/2026 | Change |
|---|---|---|---|
| Net sales (¥ million) | 72,509 | 65,567 | +10.6% |
| Gross profit (¥ million) | 16,272 | 12,612 | +29.0% |
| Gross margin | 22.4% | 19.2% | +3.2 pt |
| SG&A expenses (¥ million) | 7,584 | 7,079 | +7.1% |
| Operating profit (¥ million) | 8,688 | 5,533 | +57.0% |
| Operating margin | 12.0% | 8.4% | +3.6 pt |
| Ordinary profit (¥ million) | 8,663 | 5,486 | +57.9% |
| Pre-tax profit (¥ million) | 10,061 | 5,688 | +76.9% |
| Income taxes (¥ million) | 2,614 | 1,300 | +101.0% |
| Net profit attrib. to owners of parent (¥ million) | 6,233 | 3,461 | +80.1% |
| EPS (¥) | 133.01 | 68.63 | +93.8% |
| Comprehensive income (¥ million) | 7,025 | 2,796 | +151.2% |
| Transportation — revenue (¥ million) | 23,249 | 21,088 | +10.2% |
| Transportation — segment profit (¥ million) | 2,909 | 2,195 | +32.5% |
| Daily Life & Healthcare — revenue (¥ million) | 19,954 | 18,425 | +8.3% |
| Daily Life & Healthcare — segment profit (¥ million) | 2,974 | 1,958 | +51.9% |
| Electronics — revenue (¥ million) | 14,937 | 12,812 | +16.6% |
| Electronics — segment profit (¥ million) | 1,863 | 808 | +130.5% |
| Building & Construction — revenue (¥ million) | 14,362 | 13,232 | +8.5% |
| Building & Construction — segment profit (¥ million) | 912 | 532 | +71.4% |
| Total assets (¥ million) | 123,741 | 119,103 | +3.9% |
| Net assets (¥ million) | 76,416 | 78,442 | -2.6% |
| Equity ratio | 52.8% | 56.8% | -4.0 pt |
| FY3/2027 guidance — revenue (¥ million) | 145,500 | — | +10.7% |
| FY3/2027 guidance — operating profit (¥ million) | 15,500 | — | +35.9% |
| FY3/2027 guidance — ordinary profit (¥ million) | 15,400 | — | +30.7% |
| FY3/2027 guidance — net profit (¥ million) | 10,000 | — | +32.1% |
| FY3/2027 guidance — EPS (¥) | 221.04 | — | n.m. |
| Annual dividend per share (¥) | 89.00 | 54.00 | +64.8% |
JapanStockPulse provides informational content only and does not constitute investment advice. Figures are taken from the company's published earnings short report and may be subject to subsequent revision.