Higher costs offset steady sales
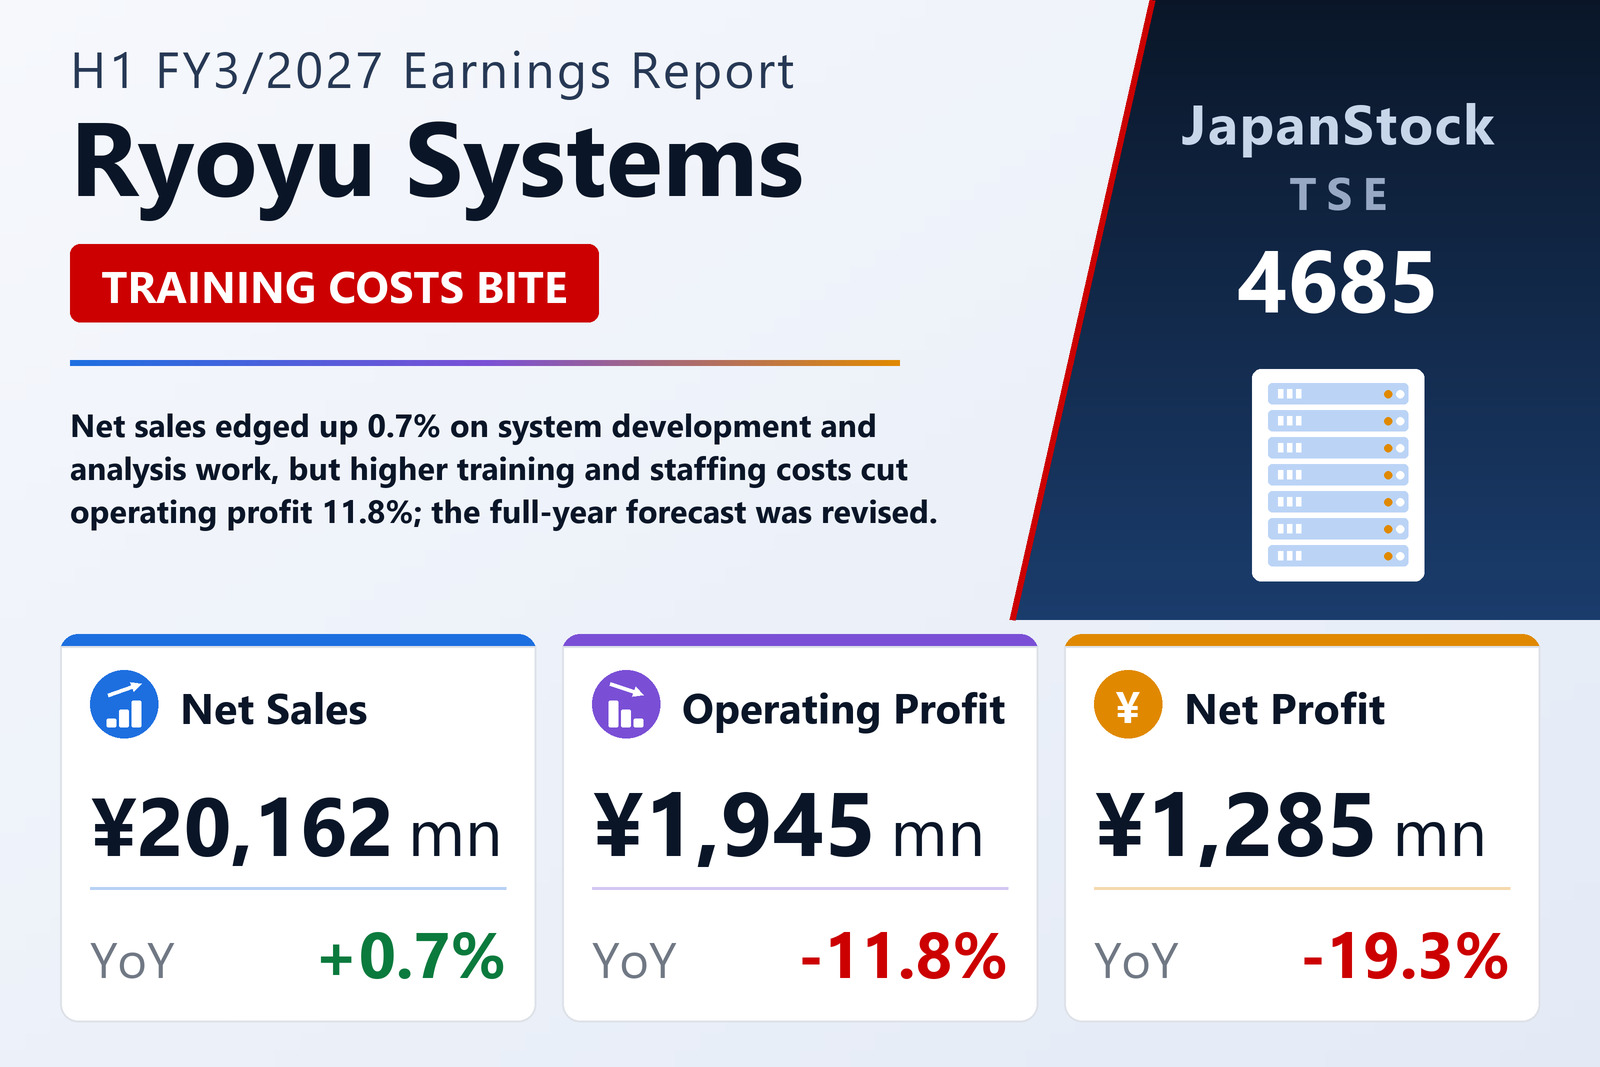
Ryoyu Systems Co., Ltd. (TSE: 4685) reported consolidated results for the first half of FY3/2027, April 1 to September 30, 2026, on October 30, 2026 under Japanese GAAP. Net sales edged up as system development and implementation support work and analysis and design work grew, although sales of software licences and other products declined. Gross profit slipped 2.9% to ¥4,297 million, while selling, general and administrative expenses rose 5.9% to ¥2,351 million on talent development, including training to keep pace with technological change, and staffing measures aimed at bringing younger employees up to speed. Operating profit therefore fell 11.8% to ¥1,945 million. Earnings per share were ¥100.72 against ¥124.85, adjusted for the two-for-one stock split of October 1, 2025. The group has a single segment, information services, and during the period pushed new products and businesses in security and generative AI.
Forecast revised, dividend plan kept
Ryoyu Systems revised the FY3/2027 forecast it published on April 28, 2026, and now expects net sales of ¥48,000 million (+11.0%), operating profit of ¥5,450 million (-0.7%), ordinary profit of ¥5,650 million (+0.5%) and net profit of ¥3,600 million (-7.9%), for earnings per share of ¥282.25; details were given in a separate notice issued the same day. It paid an interim dividend of ¥50 and still plans ¥50 at year end, an annual ¥100 against a split-adjusted ¥97.50 for FY3/2026. Total assets were ¥32,207 million and net assets rose to ¥24,906 million, lifting the equity ratio to 72.0% from 68.9%. Operating cash flow rose to ¥2,456 million from ¥1,555 million on the collection of receivables, and cash and cash equivalents increased by ¥602 million to ¥3,907 million.
| Metric | H1 FY3/2027 | H1 FY3/2026 | Change |
|---|---|---|---|
| Net sales (¥ million) | 20,162 | 20,016 | +0.7% |
| Gross profit (¥ million) | 4,297 | 4,426 | -2.9% |
| SG&A expenses (¥ million) | 2,351 | 2,220 | +5.9% |
| Operating profit (¥ million) | 1,945 | 2,205 | -11.8% |
| Ordinary profit (¥ million) | 2,045 | 2,262 | -9.6% |
| Net profit attrib. to owners of parent (¥ million) | 1,285 | 1,591 | -19.3% |
| Comprehensive income (¥ million) | 1,678 | 1,636 | +2.6% |
| EPS (¥) | 100.72 | 124.85 | -19.3% |
| Total assets (¥ million) | 32,207 | 32,234 | -0.1% |
| Net assets (¥ million) | 24,906 | 23,968 | +3.9% |
| Equity ratio | 72.0% | 68.9% | +3.1 pt |
| FY3/2027 guidance — revenue (¥ million) | 48,000 | — | +11.0% |
| FY3/2027 guidance — operating profit (¥ million) | 5,450 | — | -0.7% |
| FY3/2027 guidance — ordinary profit (¥ million) | 5,650 | — | +0.5% |
| FY3/2027 guidance — net profit (¥ million) | 3,600 | — | -7.9% |
| Annual dividend per share (¥) | 100.00 | 97.50 | +2.6% |
JapanStockPulse provides informational content only and does not constitute investment advice. Figures are taken from the company's published earnings short report and may be subject to subsequent revision.