SMBC work lifts the Finance segment
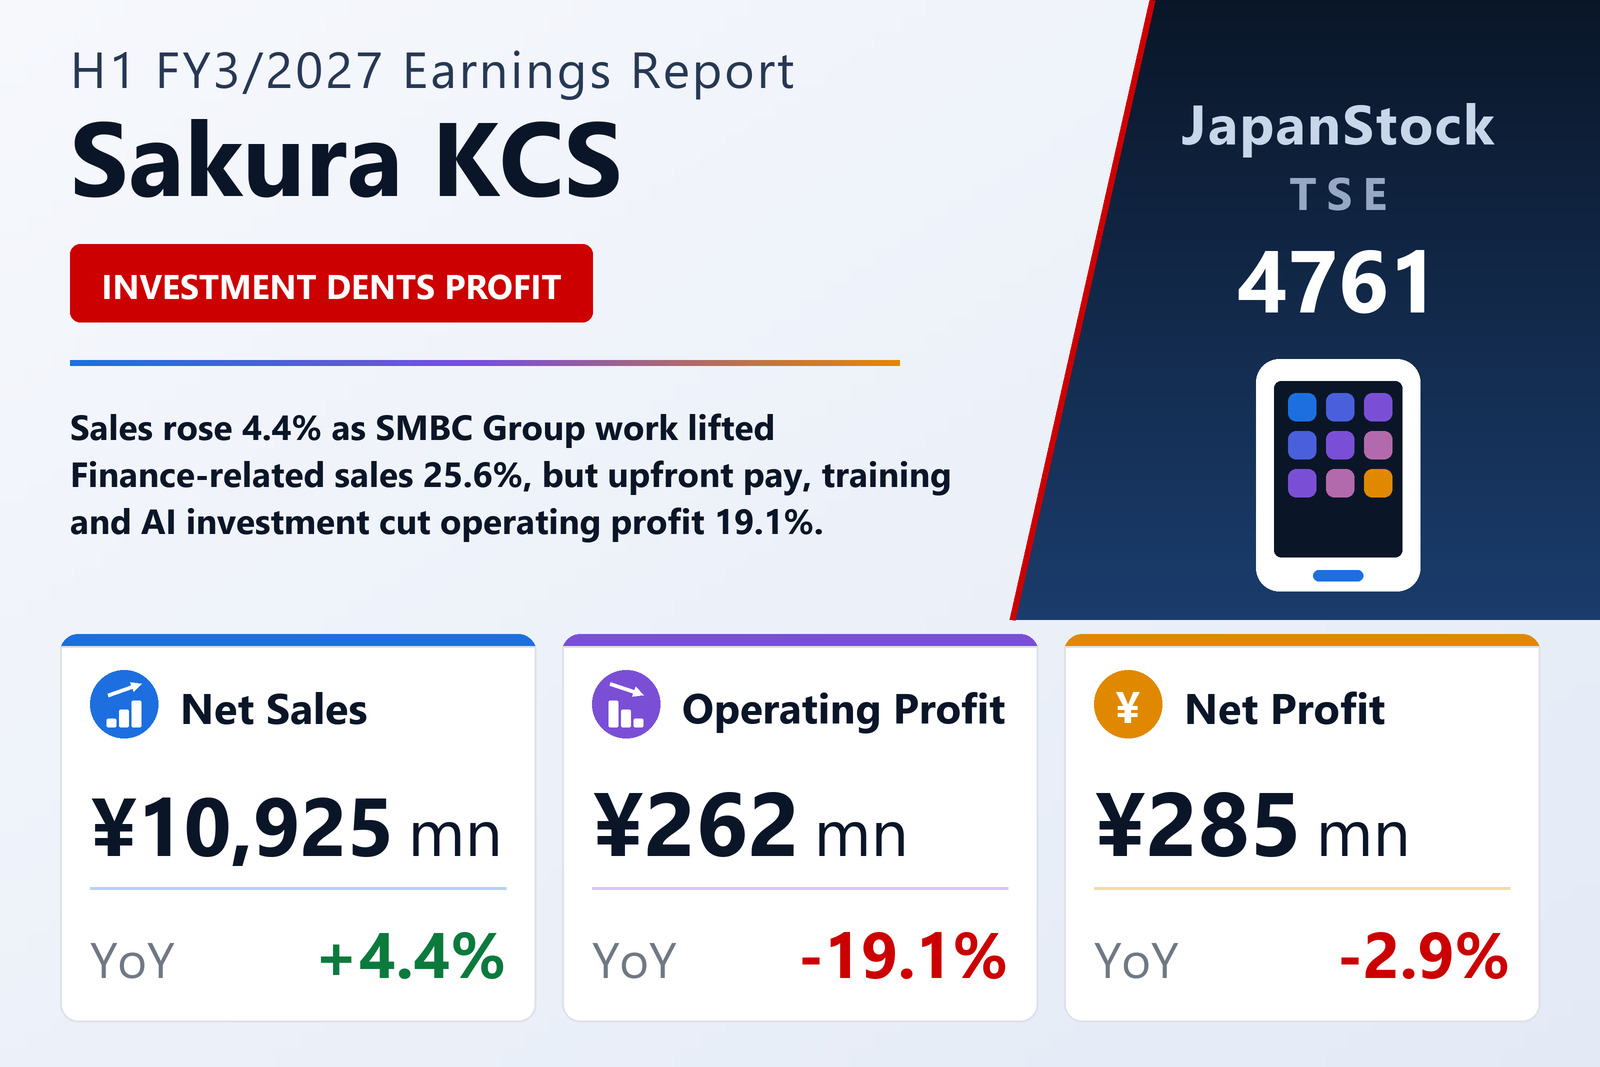
Sakura KCS Corporation (TSE: 4761) reported consolidated results for the first half of FY3/2027, April 1 to September 30, 2026, on October 30, 2026 under Japanese GAAP. Finance-related sales rose 25.6% to ¥4,356 million and segment profit 48.4% to ¥1,081 million, as system development for high-margin IT investment projects at the SMBC Group ran ahead of plan. Public-sector sales grew 5.3% to ¥2,864 million on the continuing standardisation of local-government information systems, and segment profit rose 54.2% to ¥377 million. Industry-related sales fell 13.4% to ¥3,704 million, reflecting last year's surge in equipment installations ahead of an OS support deadline and equipment sales pushed back by semiconductor shortages; its profit dropped 41.7% to ¥488 million, also weighed by investment in SAP talent. Prior-year segment figures were restated after part of the Industry-related segment was moved into Finance-related on April 1, 2026.
Guidance and dividend unchanged
Sakura KCS left its FY3/2027 forecast unchanged: net sales of ¥25,700 million (+8.0%), operating profit of ¥1,420 million (+1.1%), ordinary profit of ¥1,620 million (+0.9%) and net profit of ¥1,230 million (+0.5%), for earnings per share of ¥109.82. It paid an interim dividend of ¥31, up from ¥17, and plans ¥31 at year end, an annual ¥62 against ¥55. Earnings per share for the half were ¥25.72 against ¥26.20. Total assets fell to ¥25,289 million from ¥26,904 million and net assets to ¥20,939 million, while the equity ratio rose to 82.8% from 78.3%. Treasury shares increased to 121,562 from 789.
| Metric | H1 FY3/2027 | H1 FY3/2026 | Change |
|---|---|---|---|
| Net sales (¥ million) | 10,925 | 10,466 | +4.4% |
| Operating profit (¥ million) | 262 | 324 | -19.1% |
| Ordinary profit (¥ million) | 404 | 421 | -3.9% |
| Net profit attrib. to owners of parent (¥ million) | 285 | 293 | -2.9% |
| Comprehensive income (¥ million) | 451 | 521 | -13.5% |
| EPS (¥) | 25.72 | 26.20 | -1.8% |
| Finance-related — revenue (¥ million) | 4,356 | 3,469 | +25.6% |
| Finance-related — segment profit (¥ million) | 1,081 | 729 | +48.4% |
| Public-sector — revenue (¥ million) | 2,864 | 2,720 | +5.3% |
| Public-sector — segment profit (¥ million) | 377 | 245 | +54.2% |
| Industry-related — revenue (¥ million) | 3,704 | 4,275 | -13.4% |
| Industry-related — segment profit (¥ million) | 488 | 837 | -41.7% |
| Total assets (¥ million) | 25,289 | 26,904 | -6.0% |
| Net assets (¥ million) | 20,939 | 21,067 | -0.6% |
| Equity ratio | 82.8% | 78.3% | +4.5 pt |
| FY3/2027 guidance — revenue (¥ million) | 25,700 | — | +8.0% |
| FY3/2027 guidance — operating profit (¥ million) | 1,420 | — | +1.1% |
| FY3/2027 guidance — ordinary profit (¥ million) | 1,620 | — | +0.9% |
| FY3/2027 guidance — net profit (¥ million) | 1,230 | — | +0.5% |
| Annual dividend per share (¥) | 62.00 | 55.00 | +12.7% |
JapanStockPulse provides informational content only and does not constitute investment advice. Figures are taken from the company's published earnings short report and may be subject to subsequent revision.