Prices up, flour volumes down
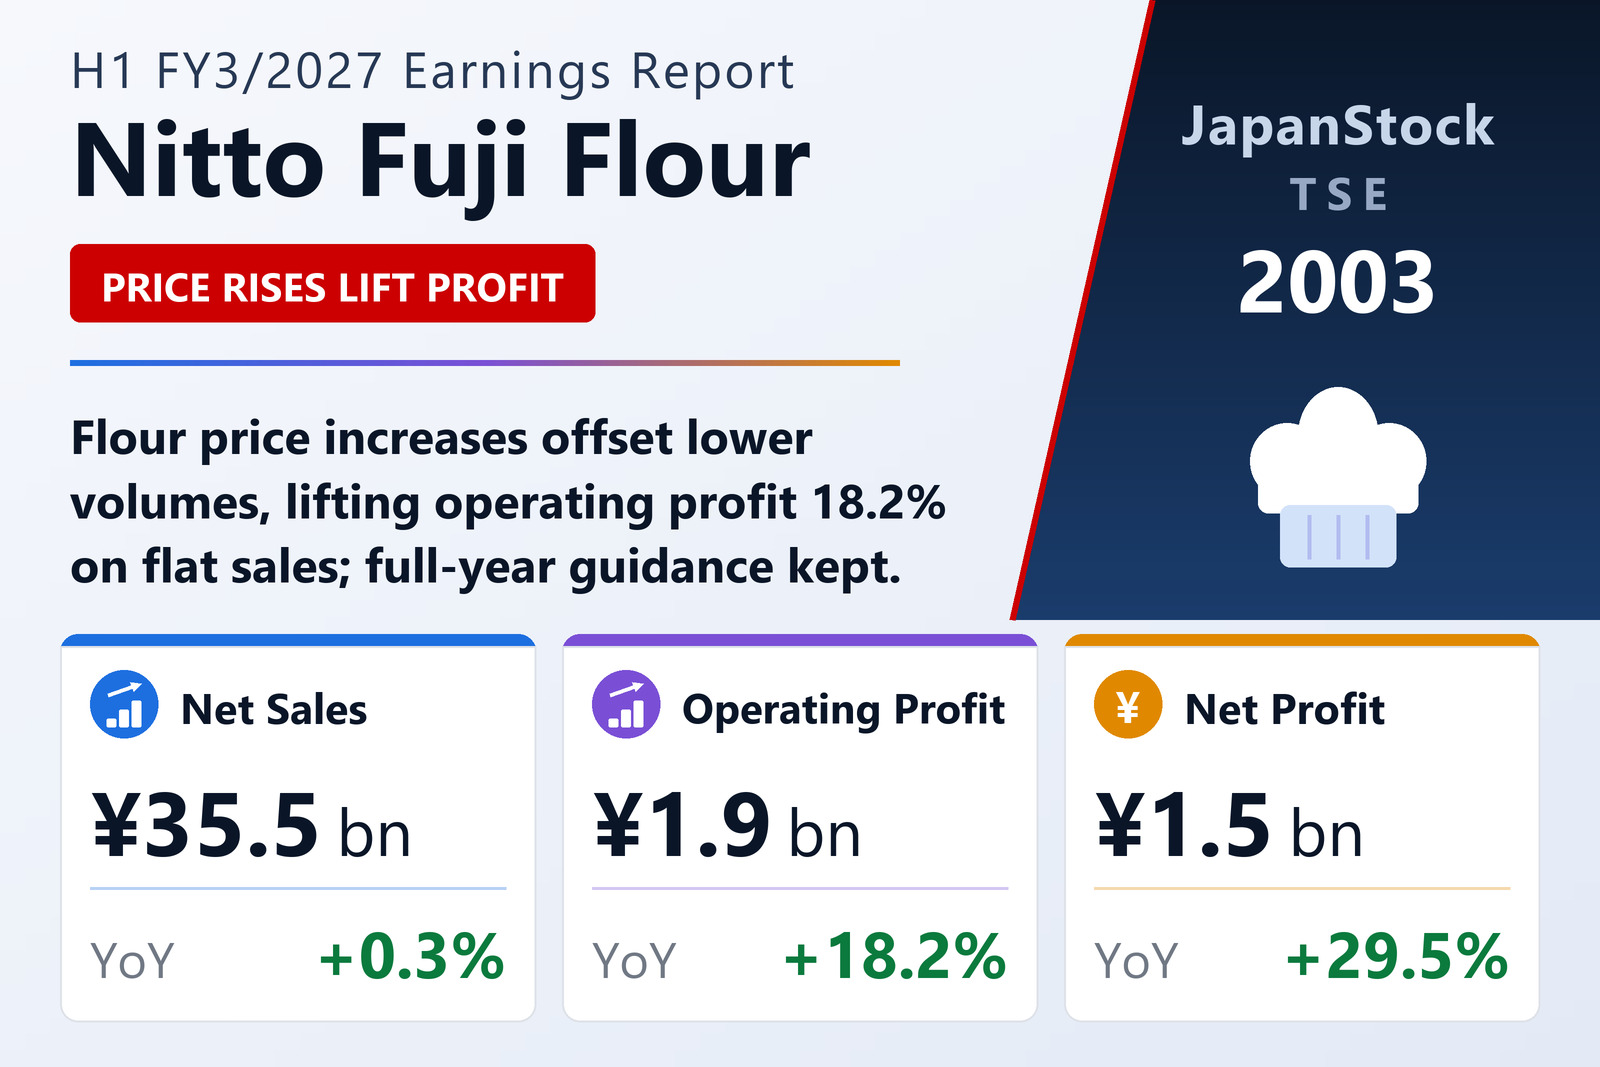
Nitto Fuji Flour Milling Co., Ltd. (TSE: 2003) reported consolidated results for the first half of FY3/2027, April 1 to September 30, 2026, on November 2, 2026 under Japanese GAAP. Sales of its core flour products fell in volume, and a former transport subsidiary that became an equity-method affiliate after a partial share sale in October 2025 dropped out of the top line, but price increases passed on to cover raw-material and logistics costs kept sales level at ¥35,502 million. The Flour milling & food segment's revenue slipped 1.3% to ¥29,421 million while its profit rose 18.1% to ¥1,826 million, helped by overseas mix-flour subsidiaries and better margins at domestic subsidiaries. The Restaurants segment, which runs Kentucky Fried Chicken franchises, grew revenue 9.5% to ¥6,085 million on new openings and lifted profit to ¥66 million from ¥2 million.
Guidance and dividend unchanged
Ordinary profit rose 20.3% to ¥2,254 million, helped by higher rental income from fixed assets, and net profit rose 29.5% to ¥1,479 million, or ¥40.64 per share, despite impairment and disposal losses. The company kept its FY3/2027 forecast of net sales of ¥73,000 million, operating profit of ¥4,200 million (+10.1%), ordinary profit of ¥4,700 million and net profit of ¥3,300 million. After its 4-for-1 stock split on April 1, 2026, it plans an annual dividend of ¥70 (¥35 interim, ¥35 year-end), the same as last year's ¥280 on a split-adjusted basis. The equity ratio rose to 79.3%.
| Metric | H1 FY3/2027 | H1 FY3/2026 | Change |
|---|---|---|---|
| Net sales (¥ million) | 35,502 | 35,414 | +0.3% |
| Operating profit (¥ million) | 1,902 | 1,609 | +18.2% |
| Ordinary profit (¥ million) | 2,254 | 1,874 | +20.3% |
| Net profit attrib. to owners of parent (¥ million) | 1,479 | 1,142 | +29.5% |
| Comprehensive income (¥ million) | 1,216 | 886 | +37.1% |
| EPS (¥) | 40.64 | 31.38 | +29.5% |
| Flour milling & food — revenue (¥ million) | 29,421 | 29,807 | -1.3% |
| Flour milling & food — segment profit (¥ million) | 1,826 | 1,547 | +18.1% |
| Restaurants — revenue (¥ million) | 6,085 | 5,557 | +9.5% |
| Restaurants — segment profit (¥ million) | 66 | 2 | n.m. |
| Total assets (¥ million) | 63,010 | 63,742 | -1.1% |
| Net assets (¥ million) | 50,047 | 50,108 | -0.1% |
| Equity ratio | 79.3% | 78.5% | +0.8 pt |
| FY3/2027 guidance — revenue (¥ million) | 73,000 | — | +0.3% |
| FY3/2027 guidance — operating profit (¥ million) | 4,200 | — | +10.1% |
| FY3/2027 guidance — ordinary profit (¥ million) | 4,700 | — | +7.2% |
| FY3/2027 guidance — net profit (¥ million) | 3,300 | — | -0.6% |
| Annual dividend per share (¥) | 70.00 | 70.00 | unchanged |
JapanStockPulse provides informational content only and does not constitute investment advice. Figures are taken from the company's published earnings short report and may be subject to subsequent revision.