Japan strong, North America constrained
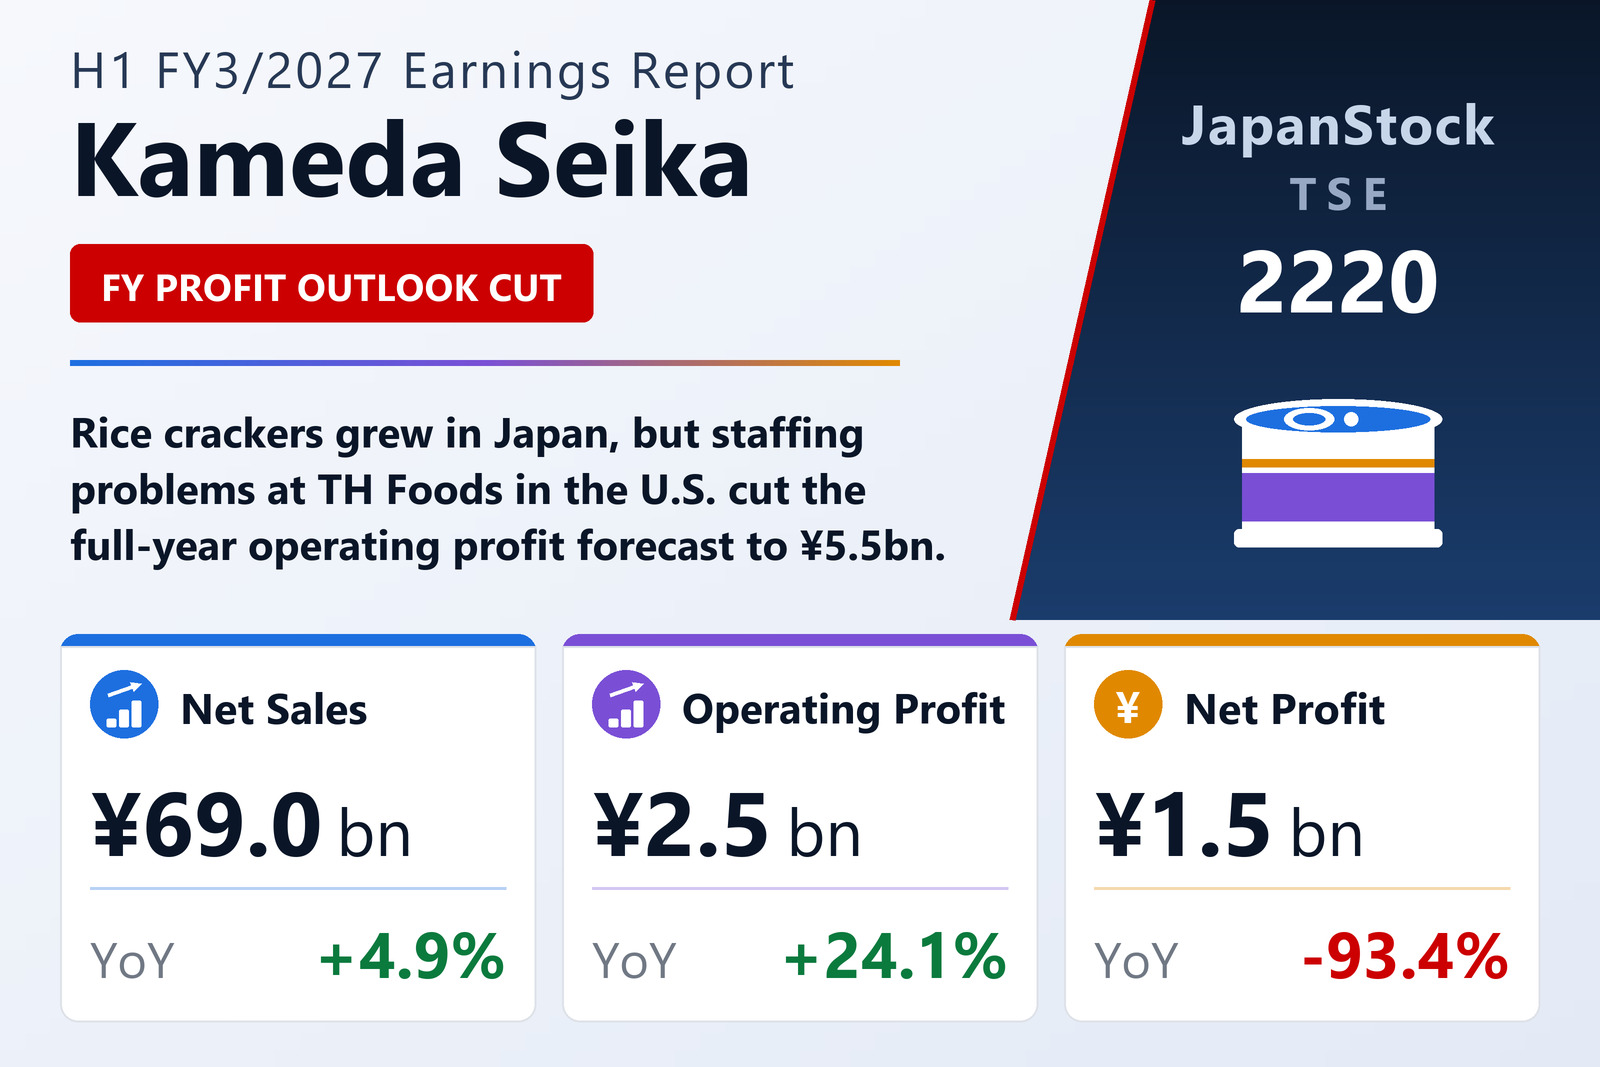
Kameda Seika Co., Ltd. (TSE: 2220) reported consolidated results for the first half of FY3/2027, April 1 to September 30, 2026, on November 2, 2026 under Japanese GAAP. Domestic rice crackers grew revenue 5.5% to ¥36,048 million and lifted profit 72.6% to ¥2,289 million, helped by last year's price increases, a better mix concentrated on six core brands, and more efficient promotion and production; Kameda no Kakinotane marked its 60th anniversary and Happy Turn its 50th. Overseas revenue rose 4.8% to ¥24,921 million in yen terms, but profit fell 95.0% to ¥18 million: at TH Foods in North America, staff turnover driven by summer heat and rising local wages cut production efficiency and cost some sales, and revenue fell in local currency. The Food segment, covering long-life emergency food and plant-based lactic acid bacteria, grew profit 51.1% to ¥230 million.
Guidance cut, dividend kept
Ordinary profit rose 20.9% to ¥2,401 million. Net profit of ¥1,480 million compares with ¥22,297 million a year earlier, when Kameda booked a ¥20,598 million gain on the step acquisition of TH Foods. The revised FY3/2027 forecast calls for net sales of ¥142,000 million (previously ¥143,000 million), operating profit of ¥5,500 million (previously ¥8,300 million), ordinary profit of ¥5,100 million (¥7,700 million) and net profit of ¥2,500 million (¥4,300 million). TH Foods is raising wages, recruiting and reworking production to restore capacity. The dividend forecast is unchanged at ¥24 for the year (¥5 interim, ¥19 year-end) after the 3-for-1 stock split on April 1, 2026, against ¥22 a year earlier on a split-adjusted basis.
| Metric | H1 FY3/2027 | H1 FY3/2026 | Change |
|---|---|---|---|
| Net sales (¥ million) | 69,003 | 65,767 | +4.9% |
| Operating profit (¥ million) | 2,474 | 1,994 | +24.1% |
| Ordinary profit (¥ million) | 2,401 | 1,986 | +20.9% |
| Net profit attrib. to owners of parent (¥ million) | 1,480 | 22,297 | -93.4% |
| Comprehensive income (¥ million) | 1,078 | 19,703 | -94.5% |
| EPS (¥) | 23.41 | 352.53 | -93.4% |
| Domestic rice crackers — revenue (¥ million) | 36,048 | 34,156 | +5.5% |
| Domestic rice crackers — segment profit (¥ million) | 2,289 | 1,327 | +72.6% |
| Overseas — revenue (¥ million) | 24,921 | 23,771 | +4.8% |
| Overseas — segment profit (¥ million) | 18 | 362 | -95.0% |
| Food — revenue (¥ million) | 4,400 | 4,155 | +5.9% |
| Food — segment profit (¥ million) | 230 | 152 | +51.1% |
| Total assets (¥ million) | 185,124 | 188,223 | -1.6% |
| Net assets (¥ million) | 106,130 | 106,466 | -0.3% |
| Equity ratio | 55.5% | 54.7% | +0.8 pt |
| FY3/2027 guidance — revenue (¥ million) | 142,000 | — | +2.9% |
| FY3/2027 guidance — operating profit (¥ million) | 5,500 | — | -26.9% |
| FY3/2027 guidance — ordinary profit (¥ million) | 5,100 | — | -32.0% |
| FY3/2027 guidance — net profit (¥ million) | 2,500 | — | -89.9% |
| Annual dividend per share (¥) | 24.00 | 22.00 | +9.1% |
JapanStockPulse provides informational content only and does not constitute investment advice. Figures are taken from the company's published earnings short report and may be subject to subsequent revision.