Meat volumes up, margins down
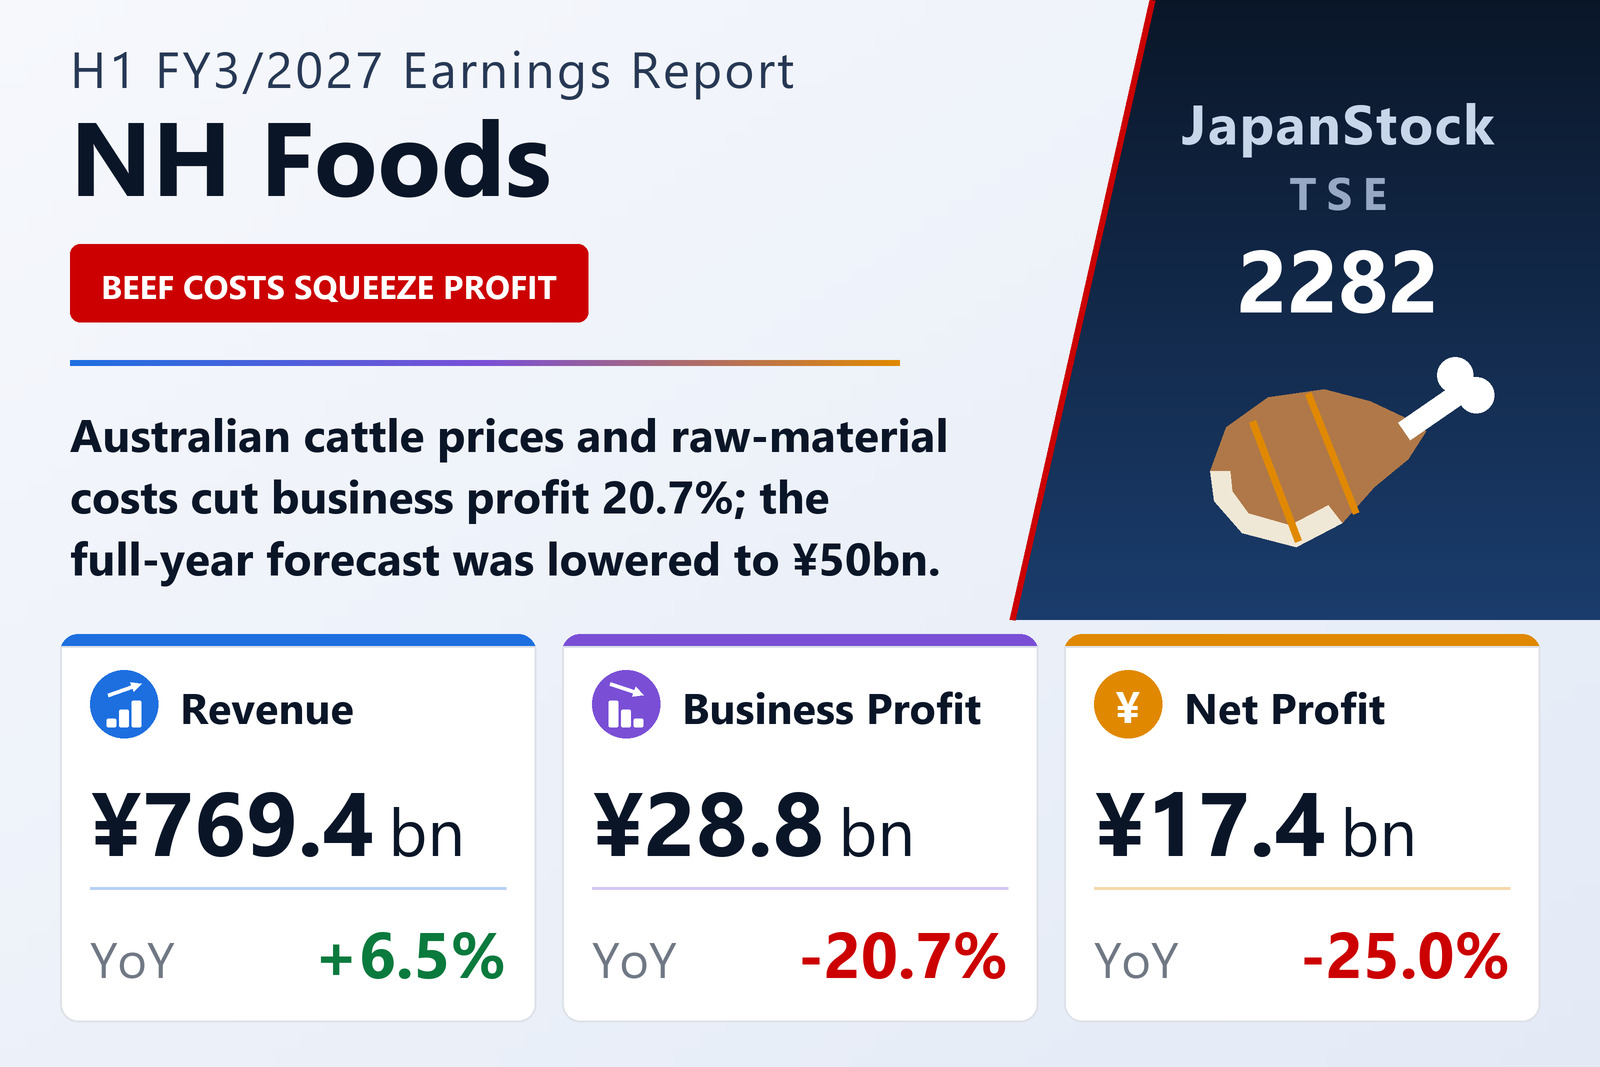
NH Foods Ltd. (TSE: 2282) reported consolidated results for the first half of FY3/2027, April 1 to September 30, 2026, on November 2, 2026 under IFRS. The Meat division grew revenue 8.9% to ¥551,886 million on strong sales volumes of domestic and imported pork and pricing that tracked procurement costs, but its business profit fell 26.8% to ¥20,270 million as Australian cattle prices rose and feed, labour and logistics costs climbed. Processed foods revenue rose 4.7% to ¥270,386 million on core consumer brands in Japan and a recovery at its North American subsidiary, but business profit fell 40.1% to ¥1,342 million on soaring raw-material prices and higher logistics expenses. The new Sports & entertainment division, which houses the Hokkaido Nippon-Ham Fighters and the Hokkaido Ballpark F Village, grew revenue 10.6% to ¥25,167 million and business profit 14.6% to ¥9,623 million on strong attendance.
Guidance and dividend reset
Profit before tax fell 19.4% to ¥30,832 million and attributable profit 25.0% to ¥17,394 million, or ¥62.26 per share on a basis adjusted for the 3-for-1 stock split of October 1, 2026. The revised FY3/2027 forecast calls for revenue of ¥1,500,000 million, business profit of ¥50,000 million (previously ¥61,000 million, -26.8%), profit before tax of ¥52,000 million and attributable profit of ¥35,000 million. The year-end dividend forecast is ¥60 per post-split share, against ¥160 paid for FY3/2026 before the split. Interest-bearing debt rose 26.8% to ¥289,804 million as the company raised funds and meat inventories grew, and the ratio of equity attributable to owners fell to 50.5%.
| Metric | H1 FY3/2027 | H1 FY3/2026 | Change |
|---|---|---|---|
| Revenue (¥ million) | 769,358 | 722,599 | +6.5% |
| Business profit (¥ million) | 28,806 | 36,341 | -20.7% |
| Pre-tax profit (¥ million) | 30,832 | 38,273 | -19.4% |
| Net profit attrib. to owners of parent (¥ million) | 17,394 | 23,188 | -25.0% |
| Comprehensive income (¥ million) | 19,380 | 30,767 | -37.0% |
| EPS (¥) | 62.26 | 78.40 | -20.6% |
| Processed foods — revenue (¥ million) | 270,386 | 258,241 | +4.7% |
| Processed foods — business profit (¥ million) | 1,342 | 2,239 | -40.1% |
| Meat — revenue (¥ million) | 551,886 | 506,712 | +8.9% |
| Meat — business profit (¥ million) | 20,270 | 27,710 | -26.8% |
| Sports & entertainment — revenue (¥ million) | 25,167 | 22,758 | +10.6% |
| Sports & entertainment — business profit (¥ million) | 9,623 | 8,395 | +14.6% |
| Total assets (¥ million) | 1,023,011 | 997,477 | +2.6% |
| Equity attrib. to owners of parent (¥ million) | 516,957 | 536,940 | -3.7% |
| Equity ratio | 50.5% | 53.8% | -3.3 pt |
| FY3/2027 guidance — revenue (¥ million) | 1,500,000 | — | +2.9% |
| FY3/2027 guidance — business profit (¥ million) | 50,000 | — | -26.8% |
| FY3/2027 guidance — pre-tax profit (¥ million) | 52,000 | — | -4.7% |
| FY3/2027 guidance — net profit (¥ million) | 35,000 | — | -0.2% |
| Annual dividend per share (¥) | 60.00 | — | — |
JapanStockPulse provides informational content only and does not constitute investment advice. Figures are taken from the company's published earnings short report and may be subject to subsequent revision.