Global products and royalties drive growth
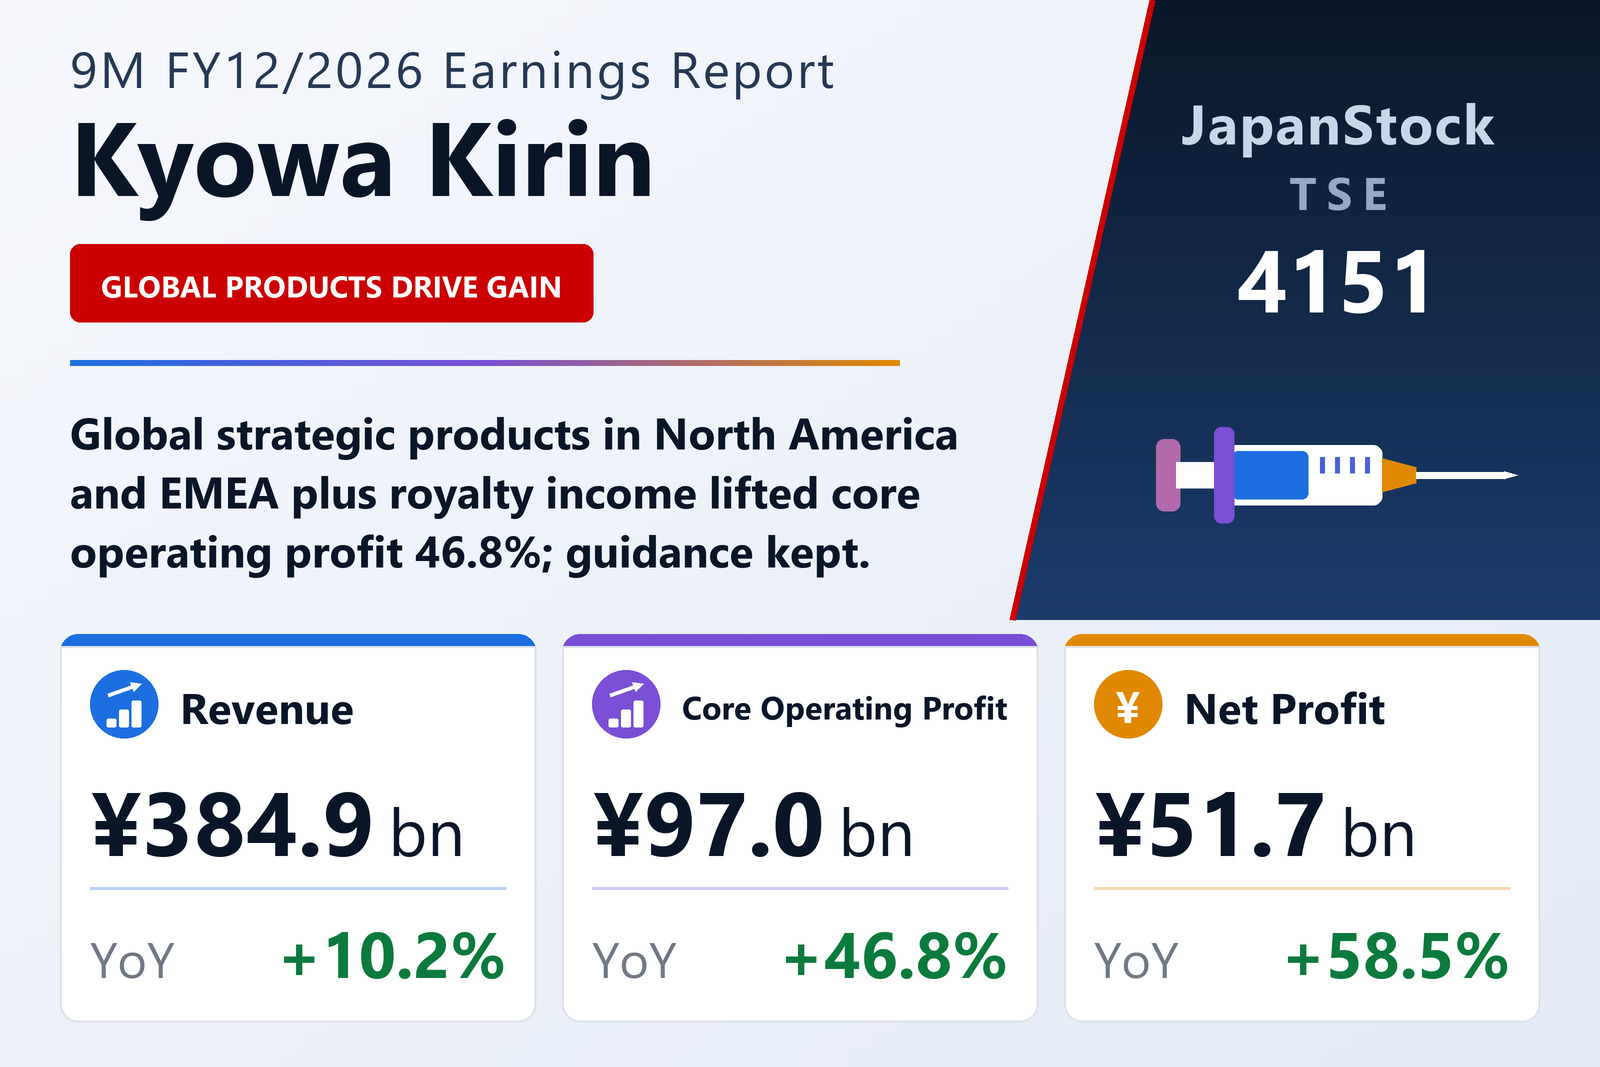
Kyowa Kirin Co., Ltd. (TSE: 4151) reported consolidated results for the first nine months of FY12/2026, January 1 to September 30, 2026, on November 2, 2026 under IFRS. Revenue grew on global strategic products, led by North America and EMEA, and on higher technology (royalty) revenue; a weaker yen added ¥19.8 billion to revenue, with the average dollar rate at ¥159 against ¥149. Japan revenue, by contrast, fell 6.7% to ¥83.7 billion. Core operating profit, which from this year excludes amortisation of intangible assets, equity-method results and items the company judges non-recurring, rose 46.8% to ¥96,952 million on higher gross profit and lower R&D spending; currency added ¥8.5 billion. Other expenses rose on contract losses and impairment charges, so profit before tax increased a smaller 35.1% to ¥64,728 million.
Guidance and dividend unchanged
Attributable profit rose 58.5% to ¥51,673 million, or ¥98.70 per share, and core net profit 72.2% to ¥77,398 million. Kyowa Kirin kept its FY12/2026 forecast of revenue of ¥520,000 million, core operating profit of ¥130,000 million (+18.4%), profit before tax of ¥95,000 million and net profit of ¥75,000 million. Orchard Therapeutics Limited left the scope of consolidation during the period, and total assets fell to ¥1,088,380 million after the transfer of its EMEA established-medicines joint venture reduced intangible assets and goodwill. The annual dividend forecast is unchanged at ¥70 (¥35 interim, ¥35 year-end), up from ¥62, and the ratio of equity attributable to owners rose to 83.5%.
| Metric | 9M FY12/2026 | 9M FY12/2025 | Change |
|---|---|---|---|
| Revenue (¥ million) | 384,947 | 349,451 | +10.2% |
| Core operating profit (¥ million) | 96,952 | 66,062 | +46.8% |
| Pre-tax profit (¥ million) | 64,728 | 47,924 | +35.1% |
| Net profit attrib. to owners of parent (¥ million) | 51,673 | 32,599 | +58.5% |
| Core net profit (¥ million) | 77,398 | 44,936 | +72.2% |
| Comprehensive income (¥ million) | 50,058 | 25,998 | +92.5% |
| EPS (¥) | 98.70 | 62.28 | +58.5% |
| Total assets (¥ million) | 1,088,380 | 1,107,860 | -1.8% |
| Equity attrib. to owners of parent (¥ million) | 908,543 | 893,332 | +1.7% |
| Equity ratio | 83.5% | 80.6% | +2.9 pt |
| FY12/2026 guidance — revenue (¥ million) | 520,000 | — | +4.7% |
| FY12/2026 guidance — core operating profit (¥ million) | 130,000 | — | +18.4% |
| FY12/2026 guidance — pre-tax profit (¥ million) | 95,000 | — | +8.9% |
| FY12/2026 guidance — net profit (¥ million) | 75,000 | — | +11.9% |
| Annual dividend per share (¥) | 70.00 | 62.00 | +12.9% |
JapanStockPulse provides informational content only and does not constitute investment advice. Figures are taken from the company's published earnings short report and may be subject to subsequent revision.