Strong overseas, weak at home
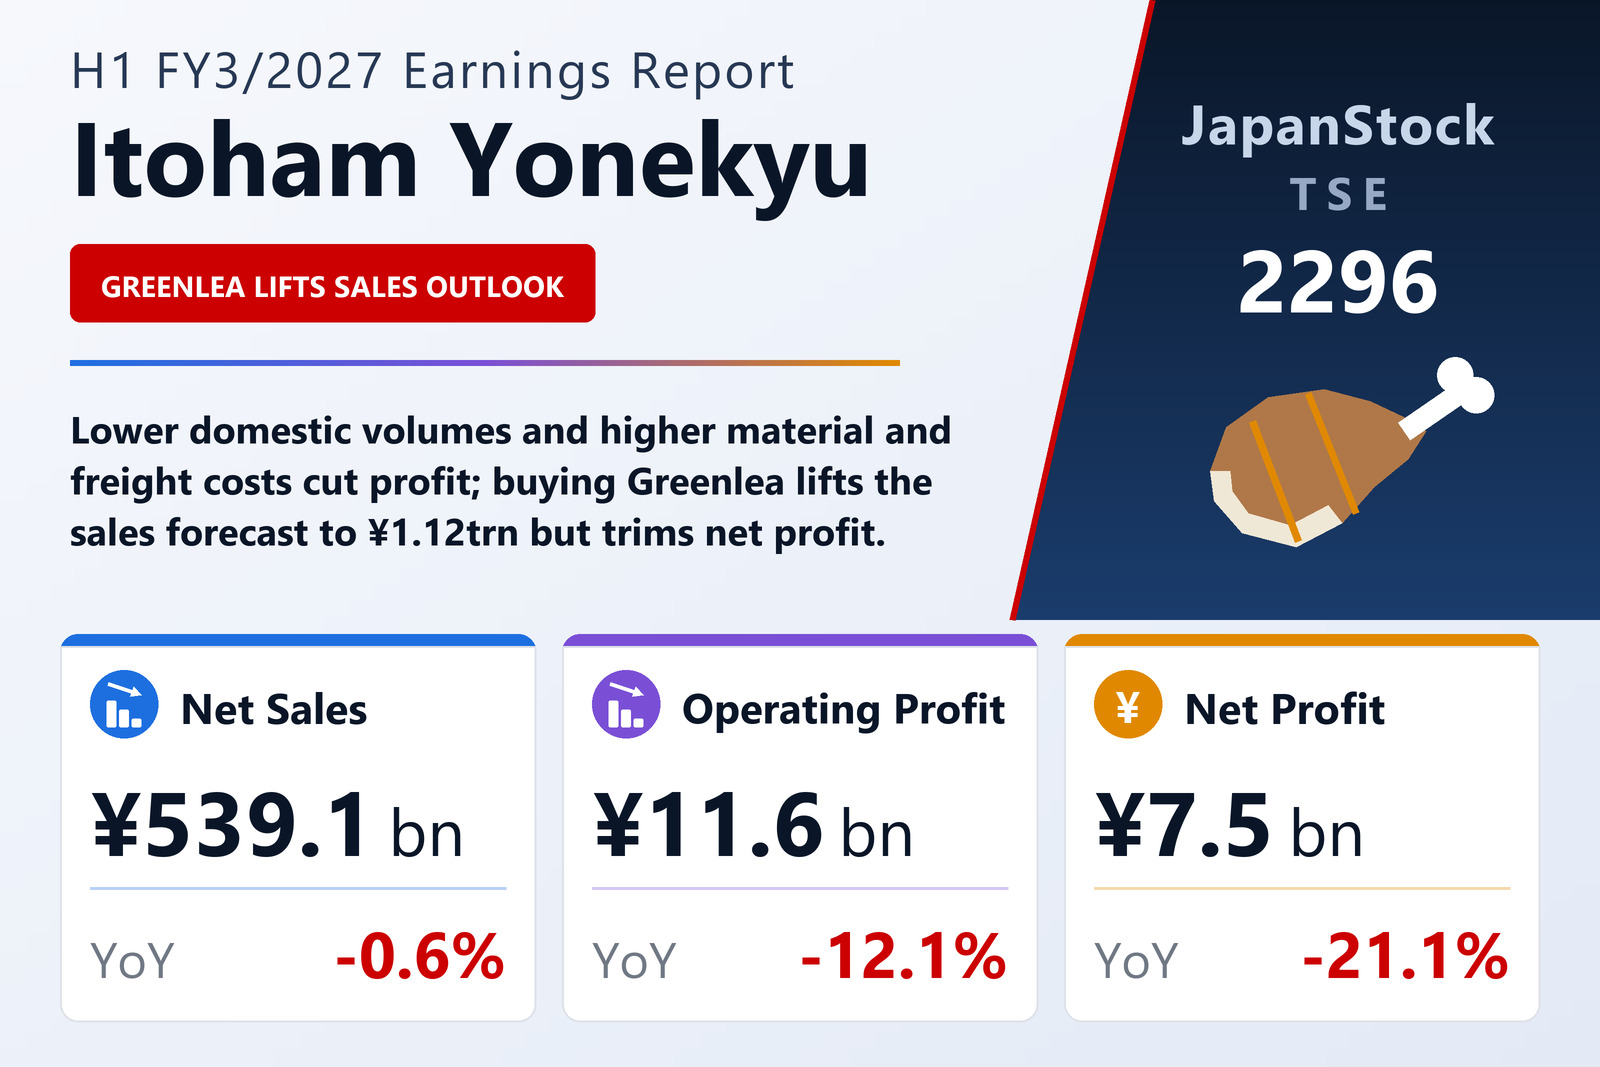
Itoham Yonekyu Holdings Inc. (TSE: 2296) reported consolidated results for the first half of FY3/2027, April 1 to September 30, 2026, on November 4, 2026. Overseas operations held up, but at home both processed foods and meat sold lower volumes while raw-material prices stayed high and logistics costs rose. The comparison was also distorted by last year's change in the reporting period of subsidiary ANZCO Foods, whose prior-year half included nine months of results.
Processed-foods sales slipped 0.8% to ¥197,044 million and the segment's ordinary profit fell 35.0% to ¥2,460 million, as price revisions and internal efficiencies could not offset higher material and freight costs, despite television advertising for core household brands. Meat sales fell 0.5% to ¥342,033 million and ordinary profit 3.4% to ¥10,102 million: domestic chicken sold well but higher Japanese beef prices and lower imported-meat volumes weighed, while ANZCO lifted profit on firmer beef prices in North America and strong lamb sales to Europe and North America.
Greenlea joins, forecast reshaped
ANZCO acquired all shares of Greenlea Group, adding goodwill and property, plant and equipment; total assets rose 16.1% to ¥609,459 million, funded largely by short-term borrowings and commercial paper, and the equity ratio fell to 47.9%. Reflecting Greenlea's second-half outlook, the company raised its FY3/2027 forecast for net sales to ¥1,120,000 million (+4.5%) and operating profit to ¥28,000 million from ¥27,000 million, but cut ordinary profit to ¥27,500 million and attributable profit to ¥18,000 million (−11.0%). It paid an interim dividend of ¥75 and plans ¥155 for the year; FY3/2026's ¥320 included ¥175 of commemorative dividends.
| Metric | H1 FY3/2027 | H1 FY3/2026 | Change |
|---|---|---|---|
| Net sales (¥ million) | 539,084 | 542,362 | -0.6% |
| Operating profit (¥ million) | 11,560 | 13,150 | -12.1% |
| Ordinary profit (¥ million) | 11,322 | 13,636 | -17.0% |
| Net profit attrib. to owners of parent (¥ million) | 7,503 | 9,508 | -21.1% |
| Comprehensive income (¥ million) | 983 | 10,427 | -90.6% |
| EPS (¥) | 132.20 | 167.58 | -21.1% |
| Processed foods — revenue (¥ million) | 197,044 | — | -0.8% |
| Processed foods — segment profit (¥ million) | 2,460 | — | -35.0% |
| Meat — revenue (¥ million) | 342,033 | — | -0.5% |
| Meat — segment profit (¥ million) | 10,102 | — | -3.4% |
| Total assets (¥ million) | 609,459 | 524,726 | +16.1% |
| Net assets (¥ million) | 292,225 | 295,509 | -1.1% |
| Equity ratio | 47.9% | 56.2% | -8.3 pt |
| FY3/2027 guidance — revenue (¥ million) | 1,120,000 | — | +4.5% |
| FY3/2027 guidance — operating profit (¥ million) | 28,000 | — | -1.6% |
| FY3/2027 guidance — ordinary profit (¥ million) | 27,500 | — | -9.5% |
| FY3/2027 guidance — net profit (¥ million) | 18,000 | — | -11.0% |
| Annual dividend per share (¥) | 155.00 | 320.00 | — |
JapanStockPulse provides informational content only and does not constitute investment advice. Figures are taken from the company's published earnings short report and may be subject to subsequent revision.