Growth outside pharma marketing
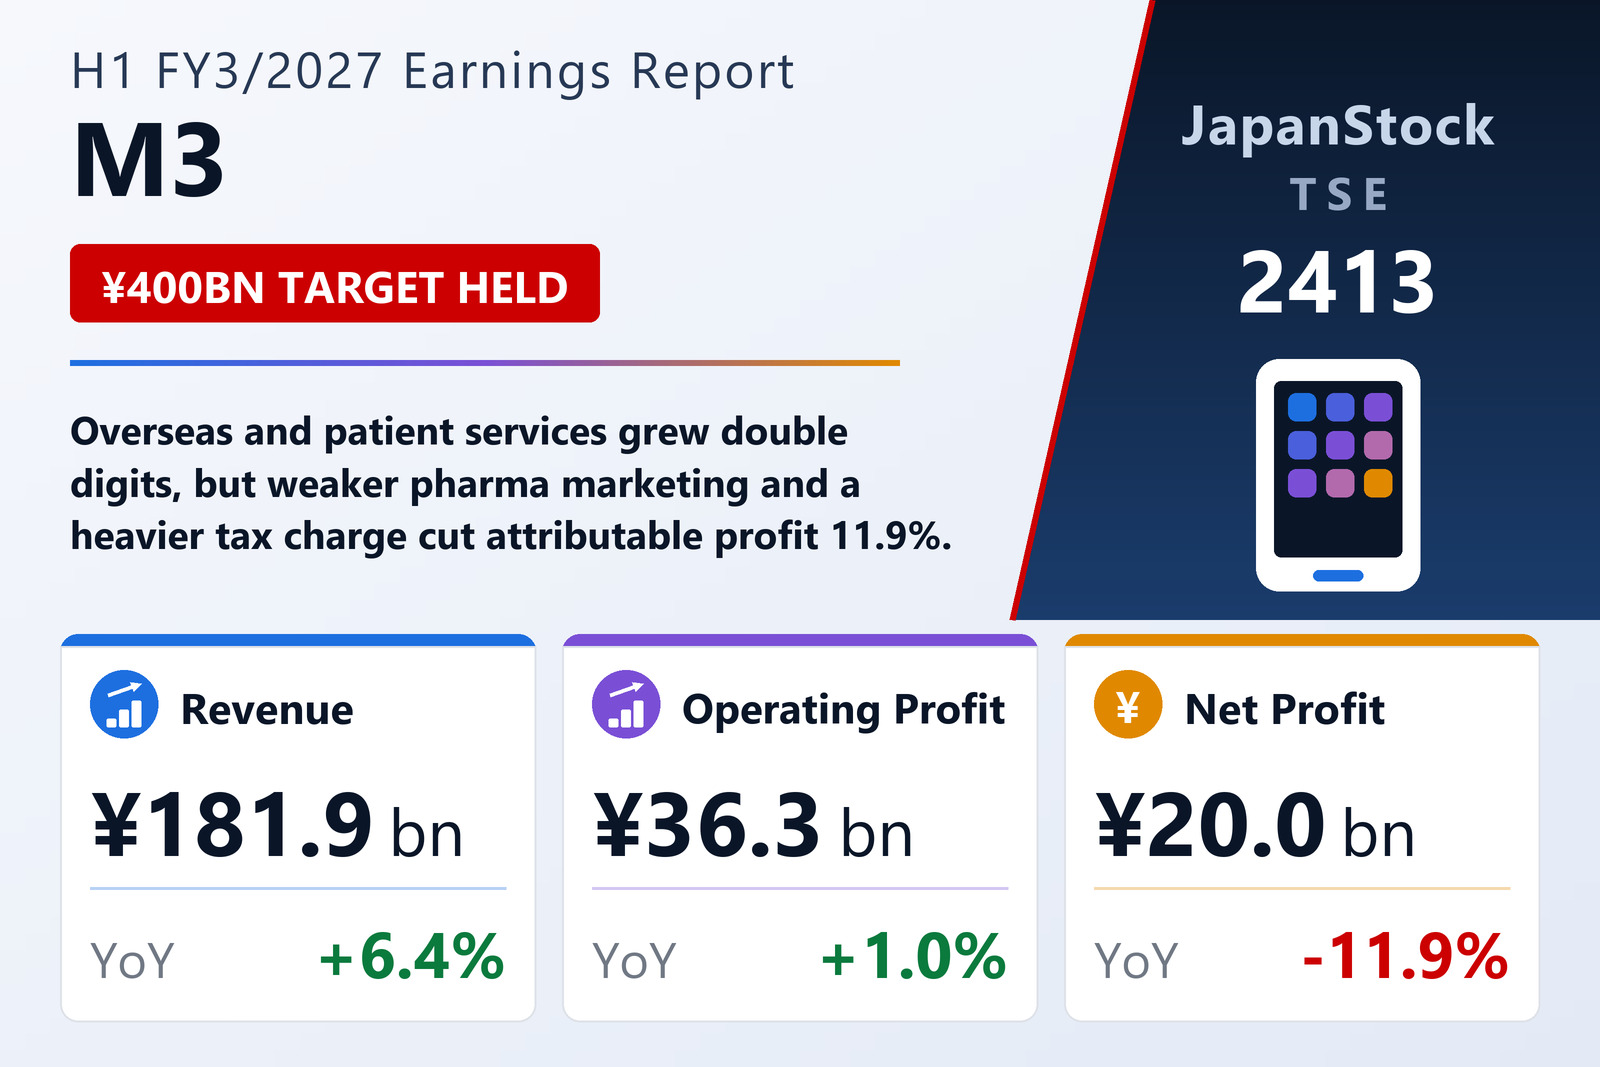
M3, Inc. (TSE: 2413) reported consolidated results for the first half of FY3/2027, April 1 to September 30, 2026, on November 4, 2026 under IFRS. Medical Platform revenue rose 4.6% to ¥54,384 million and segment profit 3.5% to ¥18,487 million: the first-time consolidation of Wiseman, acquired in July 2026, and growth in electronic medical records and other clinical DX services offset lower sales of high-margin pharmaceutical marketing support, and the segment also booked a reversal of an impairment loss. Overseas revenue grew 10.7% to ¥45,447 million and profit 10.4% to ¥9,854 million. Patient Solution revenue climbed 10.5% to ¥30,229 million and profit 90.7% to ¥2,011 million, helped by new care-support set contracts, an accounting change for patient gowns and a one-off investment gain.
Elsewhere results weakened. Evidence Solution revenue fell 3.8% and profit 15.3% to ¥1,973 million as large, high-margin projects from a year earlier were not repeated. Site Solution revenue rose 9.3% to ¥28,735 million, but profit fell 45.1% to ¥930 million on lower hospice reimbursement rates after the fee revision and upfront costs for new overseas clinics and home-nursing sites. Career Solution revenue fell 3.7%, with profit up 2.2% on a better revenue mix.
Taxes take a larger share
Profit before tax was flat at ¥36,620 million, but a heavier tax charge cut interim profit 10.7% to ¥22,623 million and attributable profit to ¥19,997 million, or ¥29.98 per share. M3 kept its FY3/2027 forecast of revenue of ¥400,000 million (+13.8%), operating profit of ¥80,000 million (+8.8%) and attributable profit of ¥53,000 million. It paid no interim dividend and left its year-end dividend undecided. The ratio of equity attributable to owners of the parent fell to 61.8%.
| Metric | H1 FY3/2027 | H1 FY3/2026 | Change |
|---|---|---|---|
| Revenue (¥ million) | 181,853 | 170,885 | +6.4% |
| Operating profit (¥ million) | 36,335 | 35,992 | +1.0% |
| Pre-tax profit (¥ million) | 36,620 | 36,681 | -0.2% |
| Net profit attrib. to owners of parent (¥ million) | 19,997 | 22,711 | -11.9% |
| Comprehensive income (¥ million) | 19,044 | 27,999 | -32.0% |
| EPS (¥) | 29.98 | 33.47 | -10.4% |
| Medical Platform — revenue (¥ million) | 54,384 | 51,977 | +4.6% |
| Medical Platform — segment profit (¥ million) | 18,487 | 17,870 | +3.5% |
| Evidence Solution — revenue (¥ million) | 11,713 | 12,180 | -3.8% |
| Evidence Solution — segment profit (¥ million) | 1,973 | 2,331 | -15.3% |
| Career Solution — revenue (¥ million) | 12,686 | 13,175 | -3.7% |
| Career Solution — segment profit (¥ million) | 4,438 | 4,343 | +2.2% |
| Site Solution — revenue (¥ million) | 28,735 | 26,291 | +9.3% |
| Site Solution — segment profit (¥ million) | 930 | 1,694 | -45.1% |
| Patient Solution — revenue (¥ million) | 30,229 | 27,352 | +10.5% |
| Patient Solution — segment profit (¥ million) | 2,011 | 1,054 | +90.7% |
| Overseas — revenue (¥ million) | 45,447 | 41,063 | +10.7% |
| Overseas — segment profit (¥ million) | 9,854 | 8,925 | +10.4% |
| Total assets (¥ million) | 658,406 | 637,396 | +3.3% |
| Equity attrib. to owners of parent (¥ million) | 406,691 | 408,217 | -0.4% |
| Equity ratio | 61.8% | 64.0% | -2.2 pt |
| FY3/2027 guidance — revenue (¥ million) | 400,000 | — | +13.8% |
| FY3/2027 guidance — operating profit (¥ million) | 80,000 | — | +8.8% |
| FY3/2027 guidance — net profit (¥ million) | 53,000 | — | +7.9% |
JapanStockPulse provides informational content only and does not constitute investment advice. Figures are taken from the company's published earnings short report and may be subject to subsequent revision.