The chilled plant weighs on margins
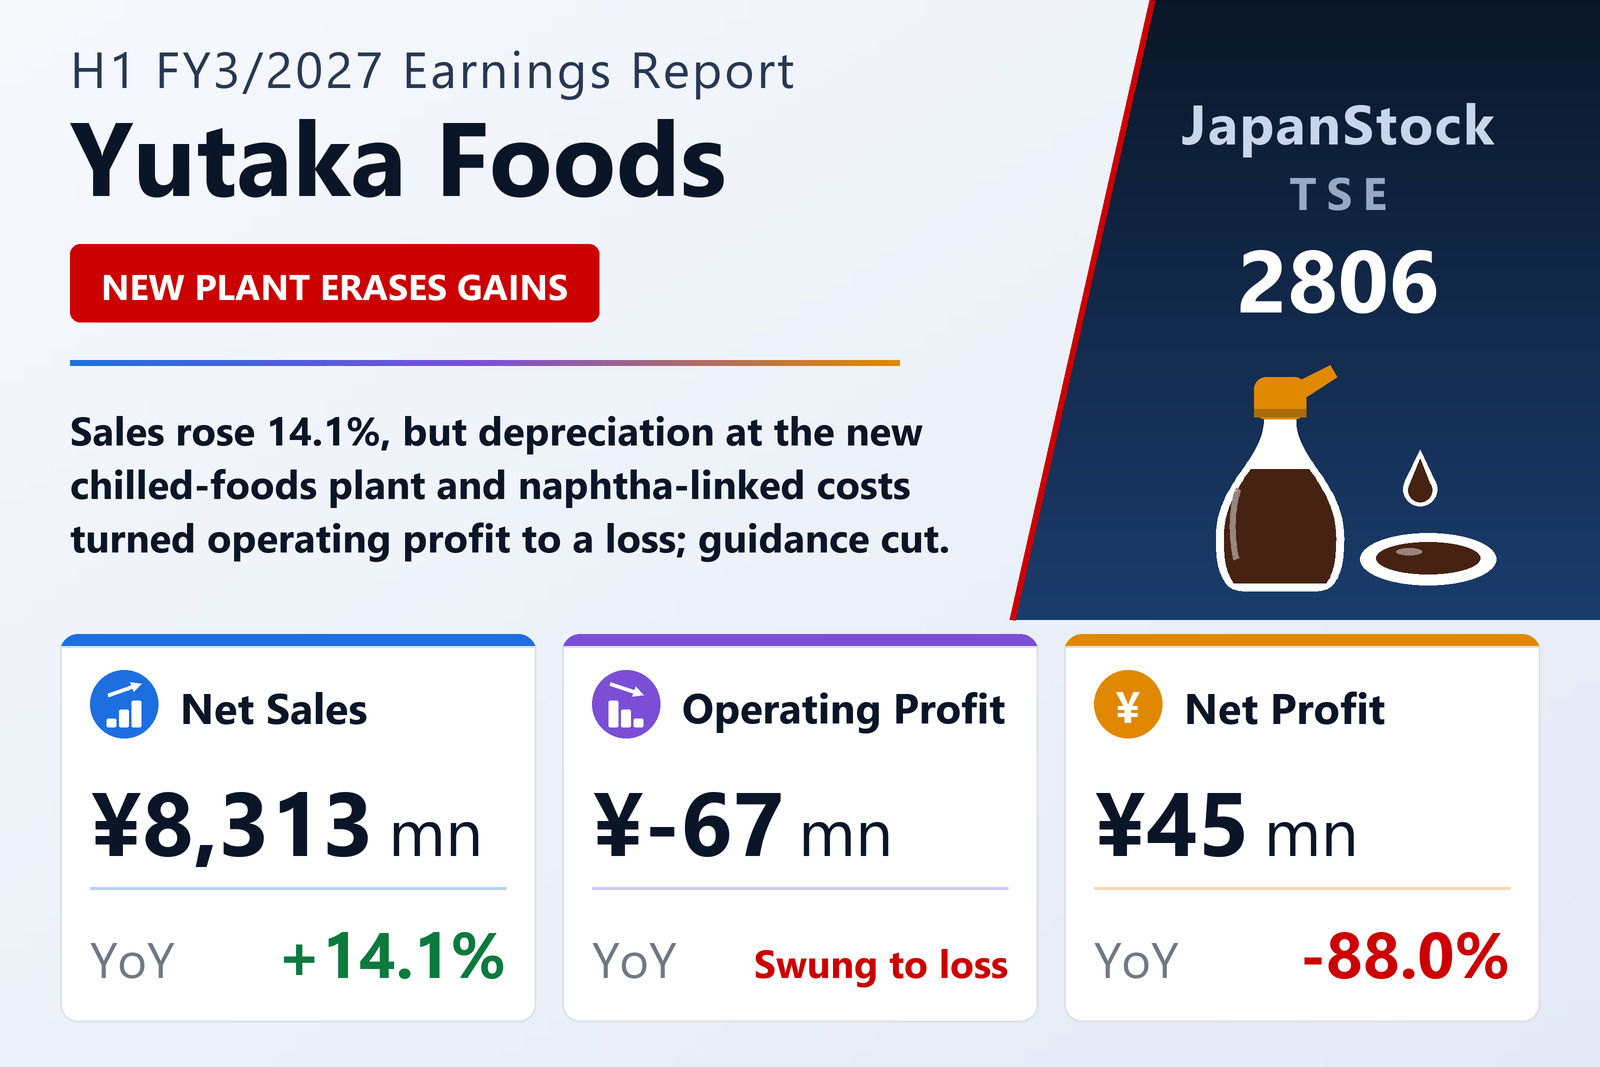
Yutaka Foods Corporation (TSE: 2806) reported non-consolidated results for the first half of FY3/2027, April 1 to September 30, 2026, on November 4, 2026. Cost of sales rose 23.3%, far faster than sales, so the gross margin fell to about 4.4% from 11.5%. Chilled foods grew sales 46.1% to ¥1,387 million on more contract work, but depreciation at its newly operating plant turned the segment to a loss of ¥566 million from a profit of ¥151 million. Net profit fell 88.0% to ¥45 million, helped by a ¥42 million gain on the sale of fixed assets.
The other segments improved. Liquid products, led by eel-sauce sales, rose 5.7% to ¥2,781 million with segment profit more than doubling to ¥215 million. Powders grew 6.7% to ¥2,625 million on contract granule products, lifting profit 47.5% to ¥249 million. Instant noodles were flat at ¥859 million with profit of ¥16 million, and Other, mainly seafood trading, rose 72.9% to ¥658 million.
Guidance lowered
The company said a prolonged Middle East conflict kept raw-material prices high, mainly for naphtha-derived materials, and a weaker yen pushed production costs above plan. It revised its forecasts, expecting full-year operating profit, ordinary profit and net profit all to come in below its earlier targets despite further cost cuts and price increases; the revised figures were published separately. Operating cash flow rose to ¥2,397 million, helped by ¥1,105 million of depreciation and a fall in consumption tax receivable, and cash rose to ¥2,296 million. The equity ratio was about 87.7%.
| Metric | H1 FY3/2027 | H1 FY3/2026 | Change |
|---|---|---|---|
| Net sales (¥ million) | 8,313 | 7,285 | +14.1% |
| Cost of sales (¥ million) | 7,948 | 6,445 | +23.3% |
| Gross profit (¥ million) | 364 | 839 | -56.6% |
| SG&A expenses (¥ million) | 432 | 409 | +5.6% |
| Operating profit (¥ million) | -67 | 430 | profit to loss |
| Ordinary profit (¥ million) | 24 | 526 | -95.4% |
| Net profit (¥ million) | 45 | 375 | -88.0% |
| Liquid — revenue (¥ million) | 2,781 | — | +5.7% |
| Liquid — segment profit (¥ million) | 215 | — | +126.2% |
| Powder — revenue (¥ million) | 2,625 | — | +6.7% |
| Powder — segment profit (¥ million) | 249 | — | +47.5% |
| Chilled foods — revenue (¥ million) | 1,387 | — | +46.1% |
| Chilled foods — segment profit (¥ million) | -566 | 151 | profit to loss |
| Instant noodles — revenue (¥ million) | 859 | — | -0.1% |
| Instant noodles — segment profit (¥ million) | 16 | — | +137.0% |
| Other — revenue (¥ million) | 658 | — | +72.9% |
| Other — segment profit (¥ million) | 18 | — | +131.5% |
| Total assets (¥ million) | 26,634 | 26,676 | -0.2% |
| Net assets (¥ million) | 23,363 | 23,019 | +1.5% |
| Equity ratio | 87.7% | 86.3% | +1.4 pt |
JapanStockPulse provides informational content only and does not constitute investment advice. Figures are taken from the company's published earnings short report and may be subject to subsequent revision.