Electronics and specialty materials turn the corner
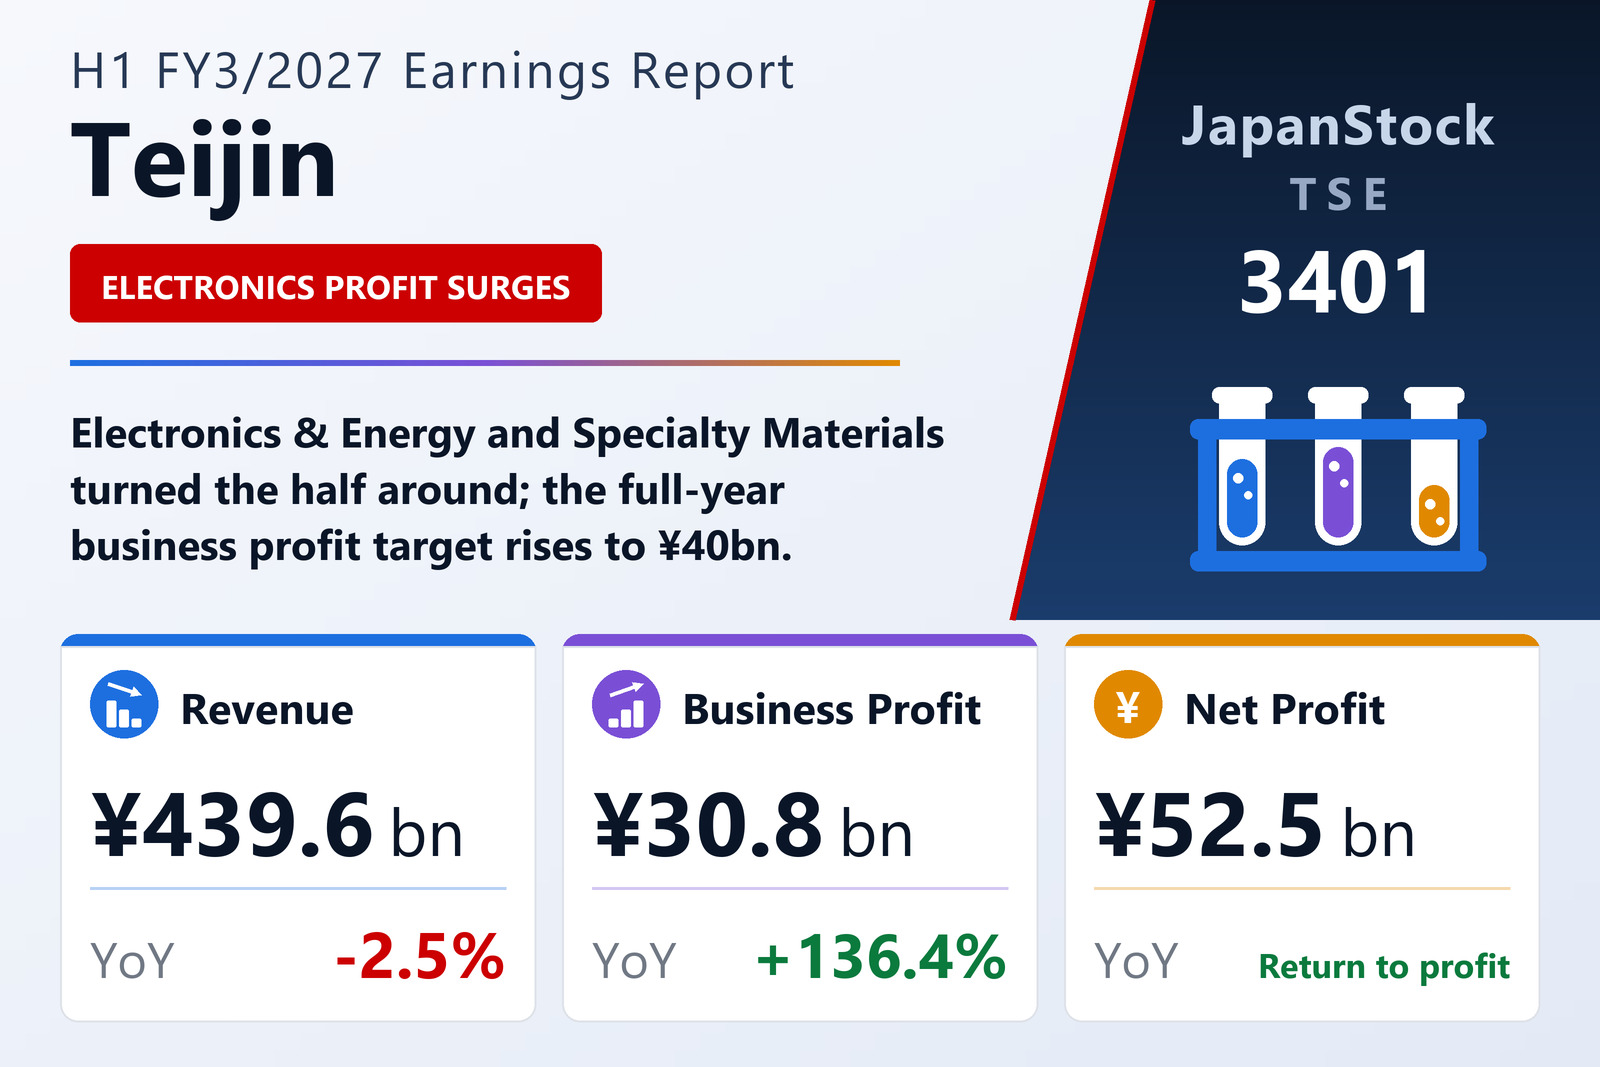
Teijin Limited (TSE: 3401) reported consolidated results under IFRS for the first half of FY3/2027, April 1 to September 30, 2026, on November 5, 2026. From this year it reports four segments in place of three, following an April 2026 reorganisation; prior-year figures were restated. Electronics & Energy lifted business profit 70.7% to ¥16,815 million on revenue up 20.4%, and Specialty Materials returned to a profit of ¥5,761 million from a loss of ¥6,233 million despite revenue down 25.1%. Apparel & Industries rose 7.8% to ¥9,668 million and Healthcare & Life Solutions edged up to ¥7,123 million.
Operating profit swung to ¥70,794 million from a loss of ¥54,082 million. Gross profit almost doubled to ¥120,479 million as cost of sales fell, other income rose to ¥55,367 million from ¥4,406 million, including the gain on the sale of a paper joint venture stake booked in the first quarter, and other expenses fell to ¥810 million from ¥16,082 million. Basic earnings per share were ¥272.26, against a loss of ¥284.41.
Forecast raised; TA Frontier formed
Teijin now expects FY3/2027 revenue of ¥920,000 million (+5.4%), business profit of ¥40,000 million (+55.2%), operating profit of ¥75,000 million and net profit attributable to owners of ¥50,000 million, up from revenue of ¥900,000 million and business profit of ¥30,000 million in its previous forecast. The dividend forecast is unchanged at ¥50. On October 1, subsidiary Teijin Frontier absorbed Asahi Kasei Advance, giving Teijin 80% of the combined company, which was renamed TA Frontier. The equity ratio rose to 45.1% from 39.6%.
| Metric | H1 FY3/2027 | H1 FY3/2026 | Change |
|---|---|---|---|
| Revenue (¥ million) | 439,562 | 451,043 | -2.5% |
| Business profit (¥ million) | 30,826 | 13,042 | +136.4% |
| Operating profit (¥ million) | 70,794 | -54,082 | loss to profit |
| Pre-tax profit (¥ million) | 69,605 | -55,765 | loss to profit |
| Net profit attrib. to owners of parent (¥ million) | 52,541 | -54,835 | loss to profit |
| EPS (¥) | 272.26 | -284.41 | loss to profit |
| Apparel & Industries — business profit (¥ million) | 9,668 | 8,972 | +7.8% |
| Healthcare & Life Solutions — business profit (¥ million) | 7,123 | 7,064 | +0.8% |
| Electronics & Energy — business profit (¥ million) | 16,815 | 9,850 | +70.7% |
| Specialty Materials — business profit (¥ million) | 5,761 | -6,233 | loss to profit |
| Total assets (¥ million) | 928,972 | 920,115 | +1.0% |
| Equity attrib. to owners of parent (¥ million) | 419,121 | 364,461 | +15.0% |
| Equity ratio | 45.1% | 39.6% | +5.5 pt |
| FY3/2027 guidance — revenue (¥ million) | 920,000 | — | +5.4% |
| FY3/2027 guidance — business profit (¥ million) | 40,000 | — | +55.2% |
| FY3/2027 guidance — operating profit (¥ million) | 75,000 | — | loss to profit |
| FY3/2027 guidance — net profit (¥ million) | 50,000 | — | loss to profit |
| Annual dividend per share (¥) | 50.00 | 50.00 | unchanged |
JapanStockPulse provides informational content only and does not constitute investment advice. Figures are taken from the company's published earnings short report and may be subject to subsequent revision.