Games, film and sensors lead
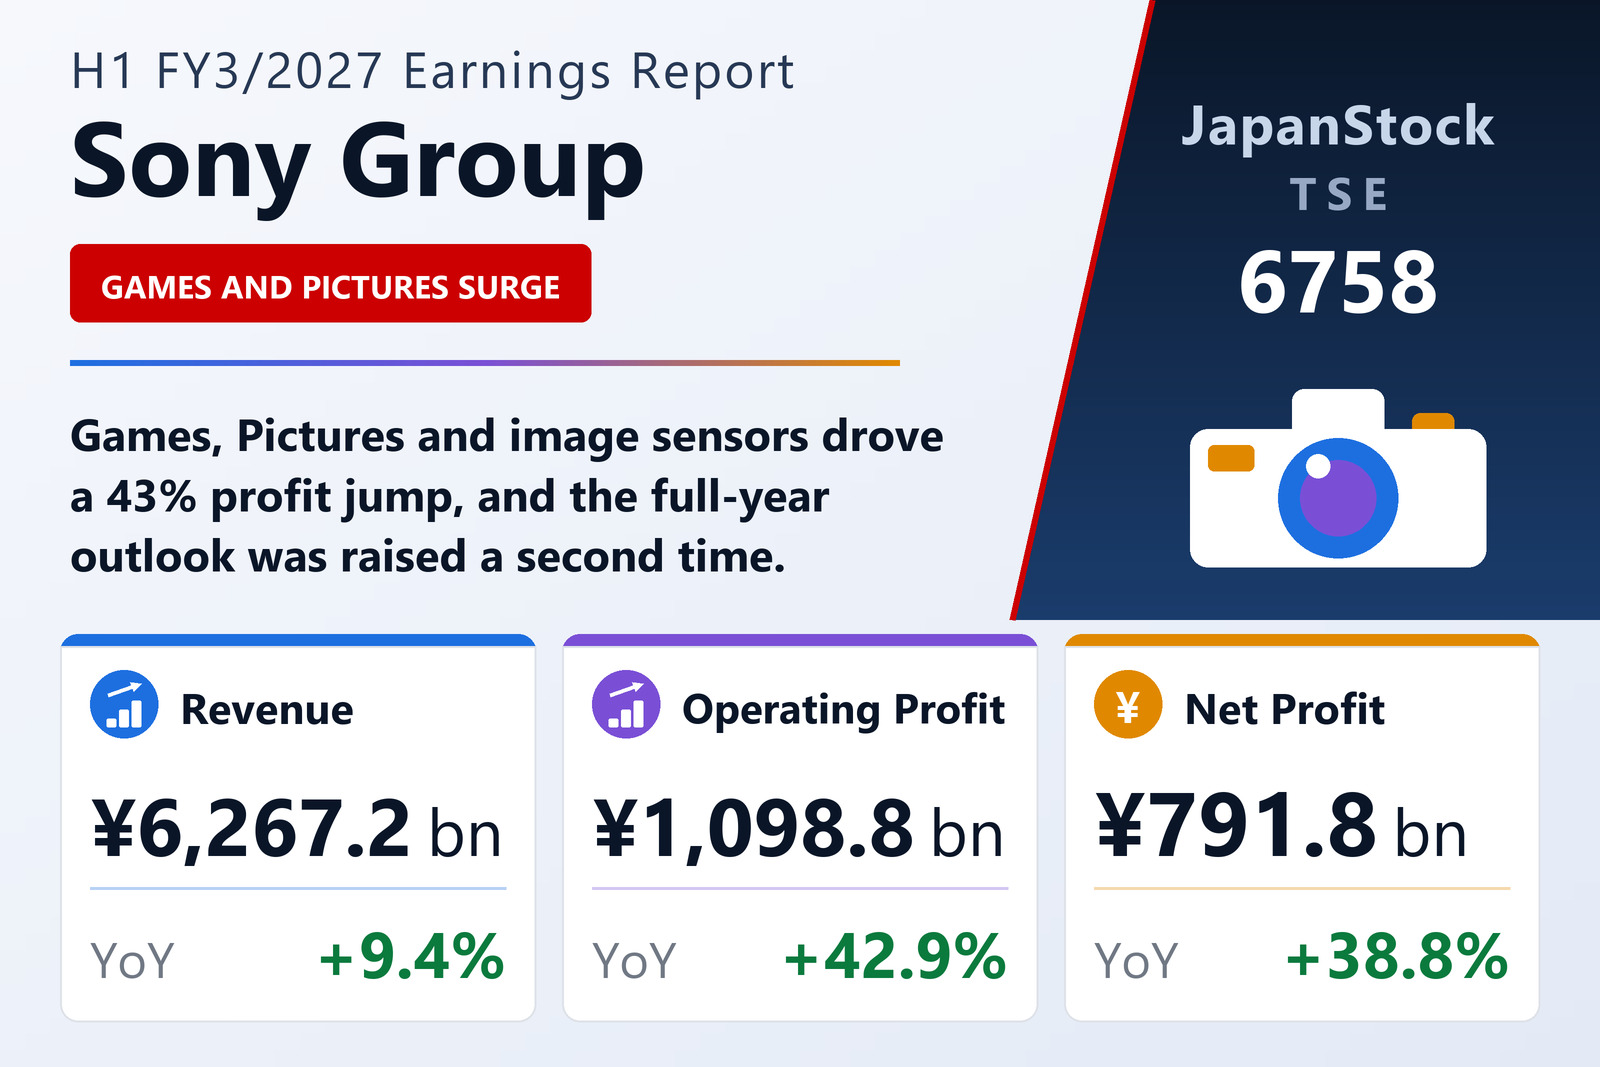
Sony Group Corporation (TSE: 6758) reported consolidated results under IFRS for the first half of FY3/2027, April 1 to September 30, 2026, on November 5, 2026. Prior-year net figures are from continuing operations, as the financial services business spun off in October 2025 is shown as discontinued. Game & Network Services operating profit rose 57.3% to ¥422,074 million on sales up 4.7% to ¥2,145,583 million. Pictures more than tripled to ¥117,363 million as its sales rose 23.1%, and Imaging & Sensing Solutions rose 43.8% to ¥276,836 million.
Music operating profit rose 9.8% to ¥228,638 million on sales up 15.2% to ¥1,160,408 million, with streaming revenue in recorded music up 18.4% to ¥479,229 million. Entertainment, Technology & Services edged up 2.5% to ¥106,746 million. The All Other segment's loss widened to ¥35,154 million from ¥7,874 million. Basic earnings per share rose to ¥134.89 from ¥95.09.
Second upgrade to the forecast
Sony now expects FY3/2027 sales of ¥13,000,000 million (+4.2%), operating profit of ¥1,870,000 million (+29.2%), profit before tax of ¥1,860,000 million (+30.8%) and net income attributable to shareholders of ¥1,330,000 million (+29.0%), up from ¥12,500,000 million, ¥1,720,000 million and ¥1,210,000 million in the forecast issued with first-quarter results. The interim dividend rose to ¥17.50 from ¥12.50, and the annual dividend forecast is ¥35. Total assets rose 6.3% to ¥16,667,715 million, and the equity ratio was 51.3%.
| Metric | H1 FY3/2027 | H1 FY3/2026 | Change |
|---|---|---|---|
| Revenue (¥ million) | 6,267,217 | 5,729,522 | +9.4% |
| Operating profit (¥ million) | 1,098,828 | 768,929 | +42.9% |
| Pre-tax profit (¥ million) | 1,100,645 | 798,362 | +37.9% |
| Net profit attrib. to owners of parent (¥ million) | 791,764 | 570,452 | +38.8% |
| EPS (¥) | 134.89 | 95.09 | +41.9% |
| Game & Network Services — segment profit (¥ million) | 422,074 | 268,311 | +57.3% |
| Music — segment profit (¥ million) | 228,638 | 208,184 | +9.8% |
| Pictures — segment profit (¥ million) | 117,363 | 32,515 | +261.0% |
| Entertainment, Technology & Services — segment profit (¥ million) | 106,746 | 104,103 | +2.5% |
| Imaging & Sensing Solutions — segment profit (¥ million) | 276,836 | 192,518 | +43.8% |
| Total assets (¥ million) | 16,667,715 | 15,683,490 | +6.3% |
| Equity attrib. to owners of parent (¥ million) | 8,550,372 | 8,119,011 | +5.3% |
| Equity ratio | 51.3% | 51.8% | -0.5 pt |
| FY3/2027 guidance — revenue (¥ million) | 13,000,000 | — | +4.2% |
| FY3/2027 guidance — operating profit (¥ million) | 1,870,000 | — | +29.2% |
| FY3/2027 guidance — net profit (¥ million) | 1,330,000 | — | +29.0% |
| Annual dividend per share (¥) | 35.00 | 25.00 | +40.0% |
JapanStockPulse provides informational content only and does not constitute investment advice. Figures are taken from the company's published earnings short report and may be subject to subsequent revision.