Margins widen; equity-method windfall from Seiwa Sogo Tatemono
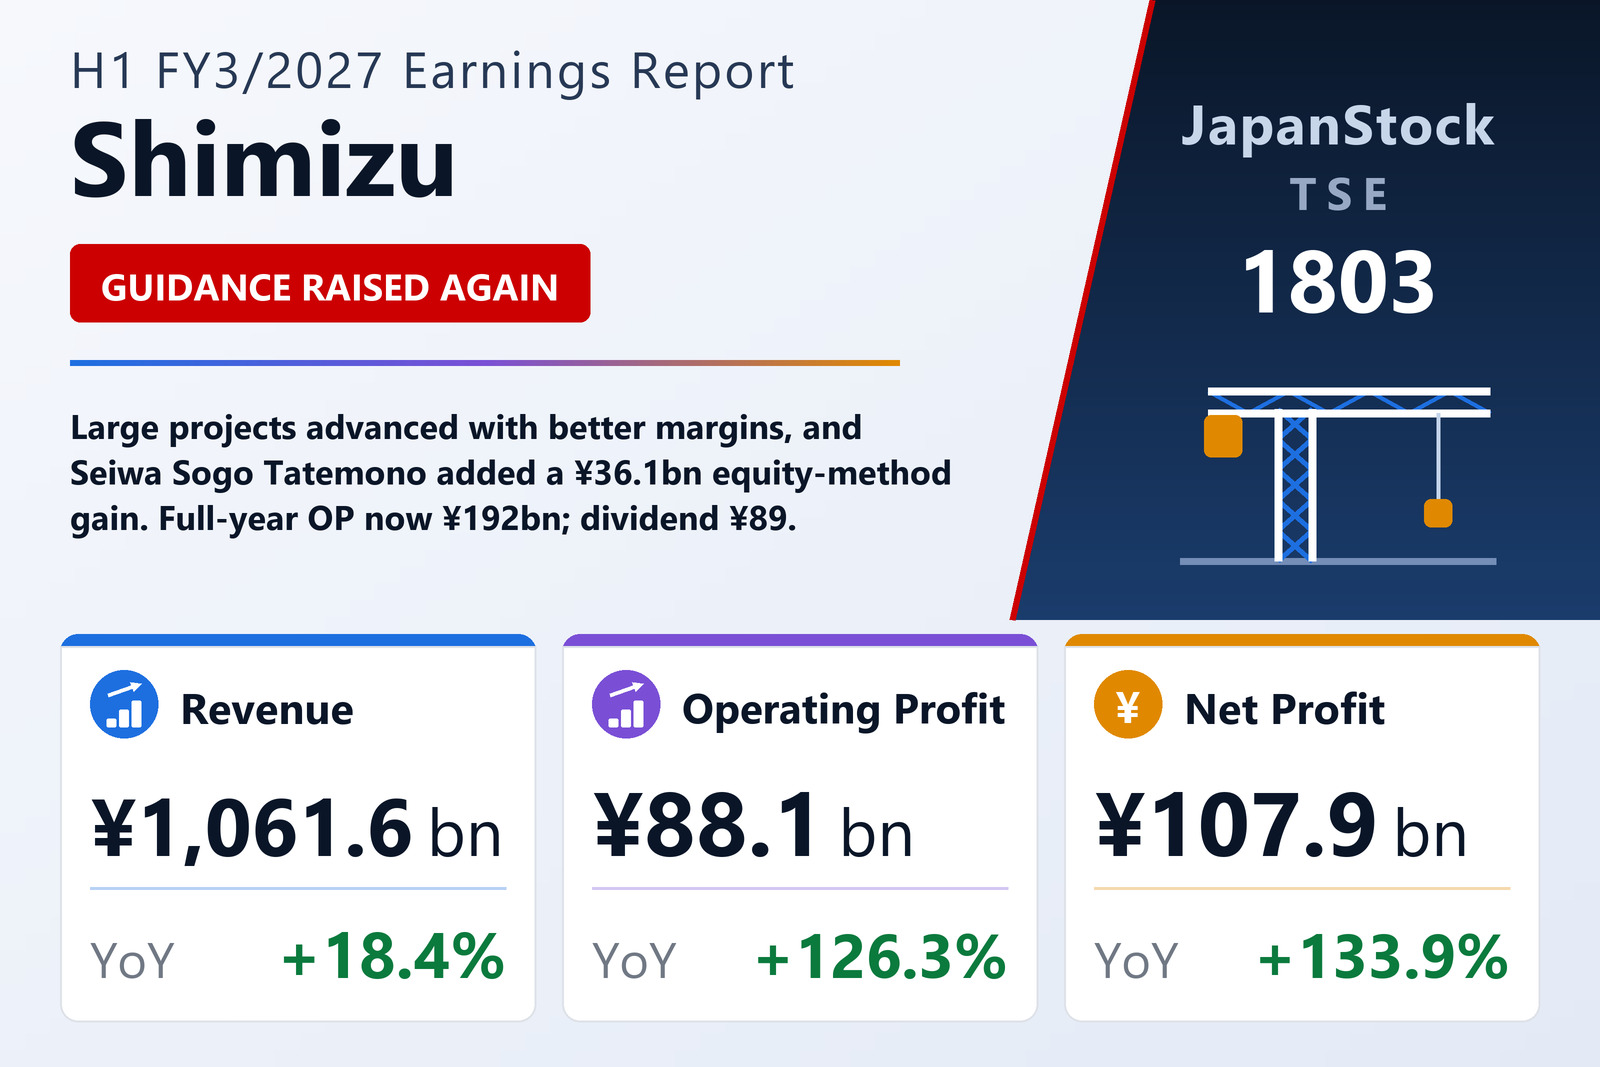
Shimizu Corporation (TSE: 1803) reported consolidated results under Japanese GAAP for the first half of FY3/2027, April 1 to September 30, 2026, on November 9, 2026. Completed construction revenue rose as its large backlog of projects advanced, and gross profit climbed 56.9% to ¥157,501 million on better project profitability. Ordinary profit tripled to ¥121,764 million because equity-method investment income jumped to ¥36,100 million from ¥116 million, mainly an amount equivalent to negative goodwill booked when Seiwa Sogo Tatemono became an equity-method affiliate.
Extraordinary income included a ¥22,033 million gain on the sale of investment securities, against ¥29,633 million a year earlier, and earnings per share rose to ¥159.19 from ¥67.93. Total assets grew ¥89.3 billion to ¥2,743,778 million, reflecting goodwill from the acquisition of American Engineering Corporation, which became a consolidated subsidiary, and the equity ratio rose to 38.2%. On October 13, 2026, Shimizu raised about ¥100 billion through two zero-coupon convertible bonds due 2031 and 2033, earmarked mainly for acquisitions and about ¥10 billion for share buybacks.
Second upgrade this year; dividend raised by ¥12
Shimizu now expects FY3/2027 net sales of ¥2,380,000 million (+15.7%), operating profit of ¥192,000 million (+61.8%), ordinary profit of ¥221,500 million (+81.1%) and net profit attributable to owners of ¥186,000 million (+46.9%), up from ¥2,310,000 million, ¥153,000 million, ¥183,500 million and ¥165,500 million in its July 30 forecast. It expects lower gains on securities sales after share-price declines in some holdings. The interim dividend was raised to ¥44.50 and the year-end forecast to ¥44.50, an annual ¥89, ¥12 above the previous plan and against ¥72 for FY3/2026.
| Metric | H1 FY3/2027 | H1 FY3/2026 | Change |
|---|---|---|---|
| Revenue (¥ million) | 1,061,632 | 897,008 | +18.4% |
| Gross profit (¥ million) | 157,501 | 100,355 | +56.9% |
| Operating profit (¥ million) | 88,073 | 38,920 | +126.3% |
| Equity-method investment income (¥ million) | 36,100 | 116 | n.m. |
| Ordinary profit (¥ million) | 121,764 | 40,112 | +203.6% |
| Gain on sale of investment securities (¥ million) | 22,033 | 29,633 | -25.6% |
| Net profit attrib. to owners of parent (¥ million) | 107,938 | 46,155 | +133.9% |
| EPS (¥) | 159.19 | 67.93 | +134.3% |
| Comprehensive income (¥ million) | 104,509 | 64,225 | +62.7% |
| Total assets (¥ million) | 2,743,778 | 2,654,382 | +3.4% |
| Net assets (¥ million) | 1,061,898 | 1,001,175 | +6.1% |
| Equity ratio | 38.2% | 36.8% | +1.4 pt |
| FY3/2027 guidance — revenue (¥ million) | 2,380,000 | — | +15.7% |
| FY3/2027 guidance — operating profit (¥ million) | 192,000 | — | +61.8% |
| FY3/2027 guidance — ordinary profit (¥ million) | 221,500 | — | +81.1% |
| FY3/2027 guidance — net profit (¥ million) | 186,000 | — | +46.9% |
| Annual dividend per share (¥) | 89.00 | 72.00 | +23.6% |
JapanStockPulse provides informational content only and does not constitute investment advice. Figures are taken from the company's published earnings short report and may be subject to subsequent revision.