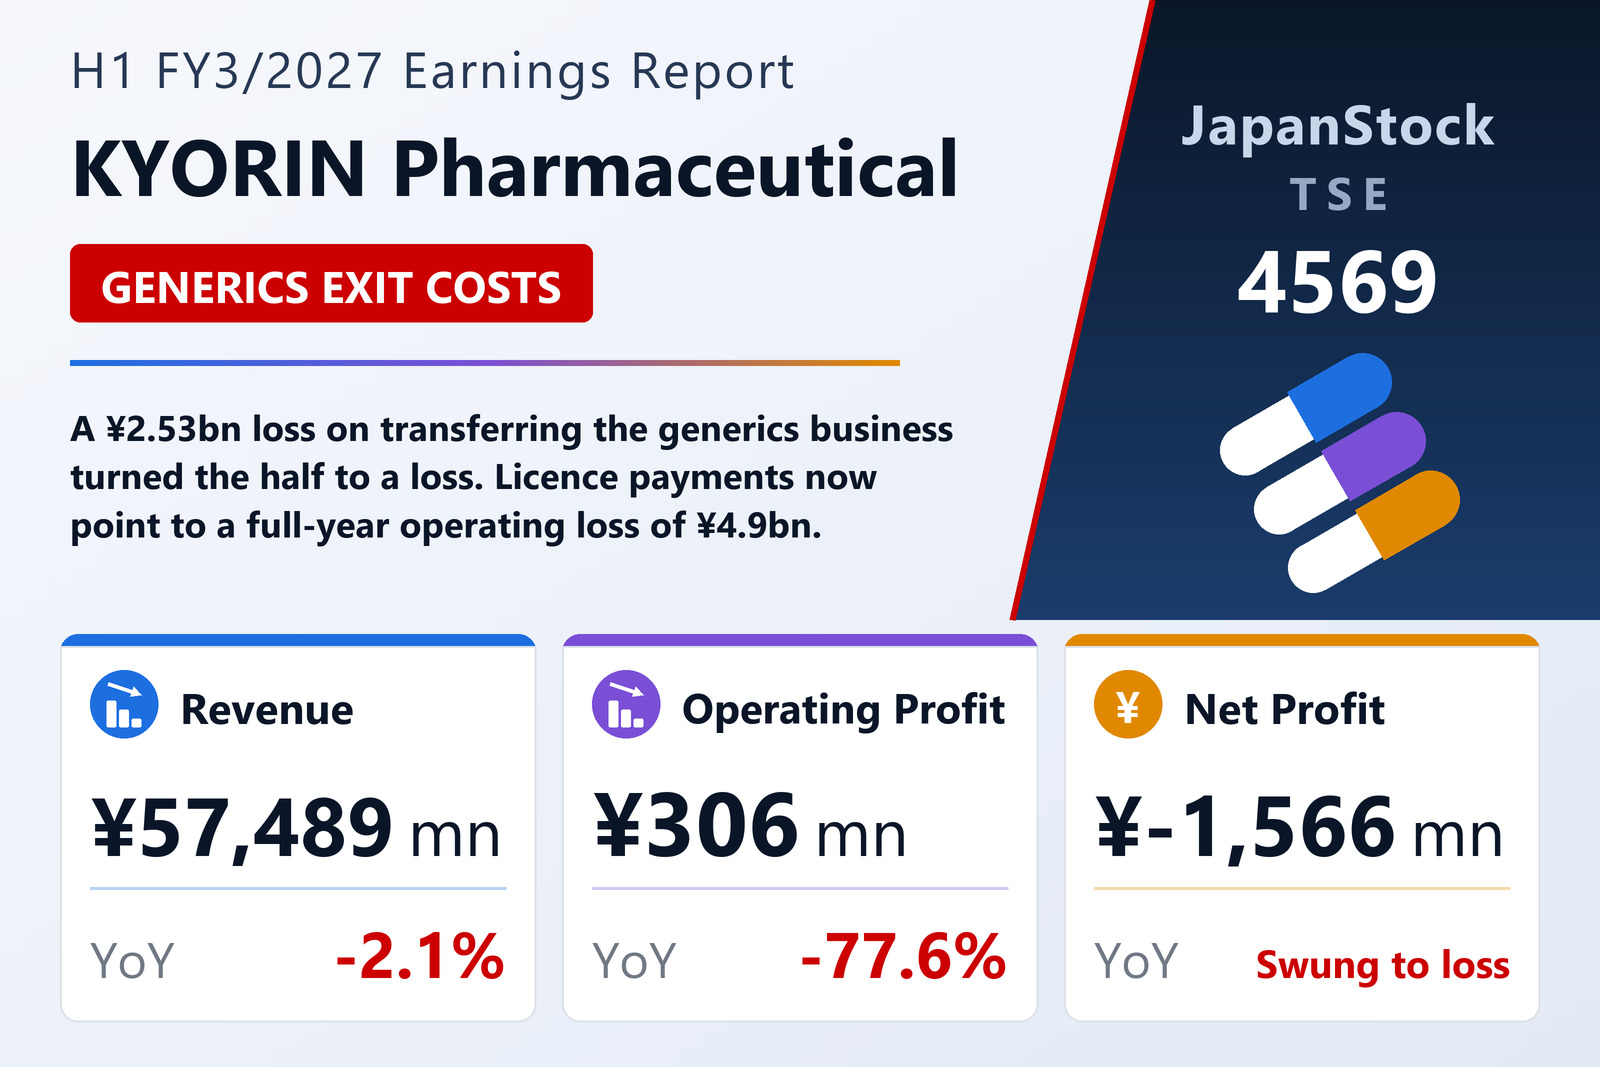
Beova grows, but price cuts and generics bite
KYORIN Pharmaceutical Co., Ltd. (TSE: 4569) reported consolidated results under Japanese GAAP for the first half of FY3/2027, April 1 to September 30, 2026, on November 9, 2026. Domestic sales of new drugs fell 2.5% to ¥40,371 million: overactive-bladder treatment Beova kept growing, but drug-price revisions of about 4% at Kyorin and generic entry against Desalex reduced sales. Overseas new-drug revenue fell 53.0% to ¥236 million as gatifloxacin income dropped back, while generic-drug sales edged up 0.4% to ¥16,881 million on authorised generics and new listings.
Gross profit fell ¥2,513 million to ¥22,382 million. Selling and administrative costs fell ¥1,456 million, including ¥980 million less research and development, because the prior-year half carried an in-licensing payment, so operating profit fell to ¥306 million and ordinary profit to ¥689 million. On September 30, Kyorin signed agreements with Daito, Meiji Seika Pharma and the Development Bank of Japan to transfer its generics business, excluding authorised generics, and the Takaoka and Inami plants to a new company formed with them; the resulting ¥2,528 million loss was booked as an extraordinary loss. The equity ratio rose to 73.9%.
Forecast cut to a loss; dividend ¥25
Kyorin kept its FY3/2027 sales forecast at ¥121,800 million (-3.5%) but now expects an operating loss of ¥4,900 million, an ordinary loss of ¥4,600 million and a net loss attributable to owners of ¥5,100 million, against earlier forecasts of profits of ¥2,000 million, ¥2,300 million and ¥1,500 million. The new outlook builds in an up-front payment under a licence agreement with Edesa Biotech and another for an in-licensed product whose contract it judges highly likely, plus the transfer loss. It paid an interim dividend of ¥10 and plans a year-end ¥15, a total of ¥25 against ¥57 for FY3/2026.
| Metric | H1 FY3/2027 | H1 FY3/2026 | Change |
|---|---|---|---|
| Revenue (¥ million) | 57,489 | 58,731 | -2.1% |
| Gross profit (¥ million) | 22,382 | 24,895 | -10.1% |
| Operating profit (¥ million) | 306 | 1,363 | -77.6% |
| Ordinary profit (¥ million) | 689 | 1,582 | -56.4% |
| Loss on business transfer (¥ million) | 2,528 | — | new |
| Net profit attrib. to owners of parent (¥ million) | -1,566 | 1,494 | profit to loss |
| EPS (¥) | -27.26 | 26.01 | profit to loss |
| Comprehensive income (¥ million) | -2,535 | 2,308 | profit to loss |
| Total assets (¥ million) | 186,819 | 195,455 | -4.4% |
| Net assets (¥ million) | 138,057 | 142,425 | -3.1% |
| Equity ratio | 73.9% | 72.9% | +1.0 pt |
| FY3/2027 guidance — revenue (¥ million) | 121,800 | — | -3.5% |
| FY3/2027 guidance — operating profit (¥ million) | -4,900 | — | profit to loss |
| FY3/2027 guidance — ordinary profit (¥ million) | -4,600 | — | profit to loss |
| FY3/2027 guidance — net profit (¥ million) | -5,100 | — | profit to loss |
| Annual dividend per share (¥) | 25.00 | 57.00 | -56.1% |
JapanStockPulse provides informational content only and does not constitute investment advice. Figures are taken from the company's published earnings short report and may be subject to subsequent revision.