Why the headline numbers are not comparable
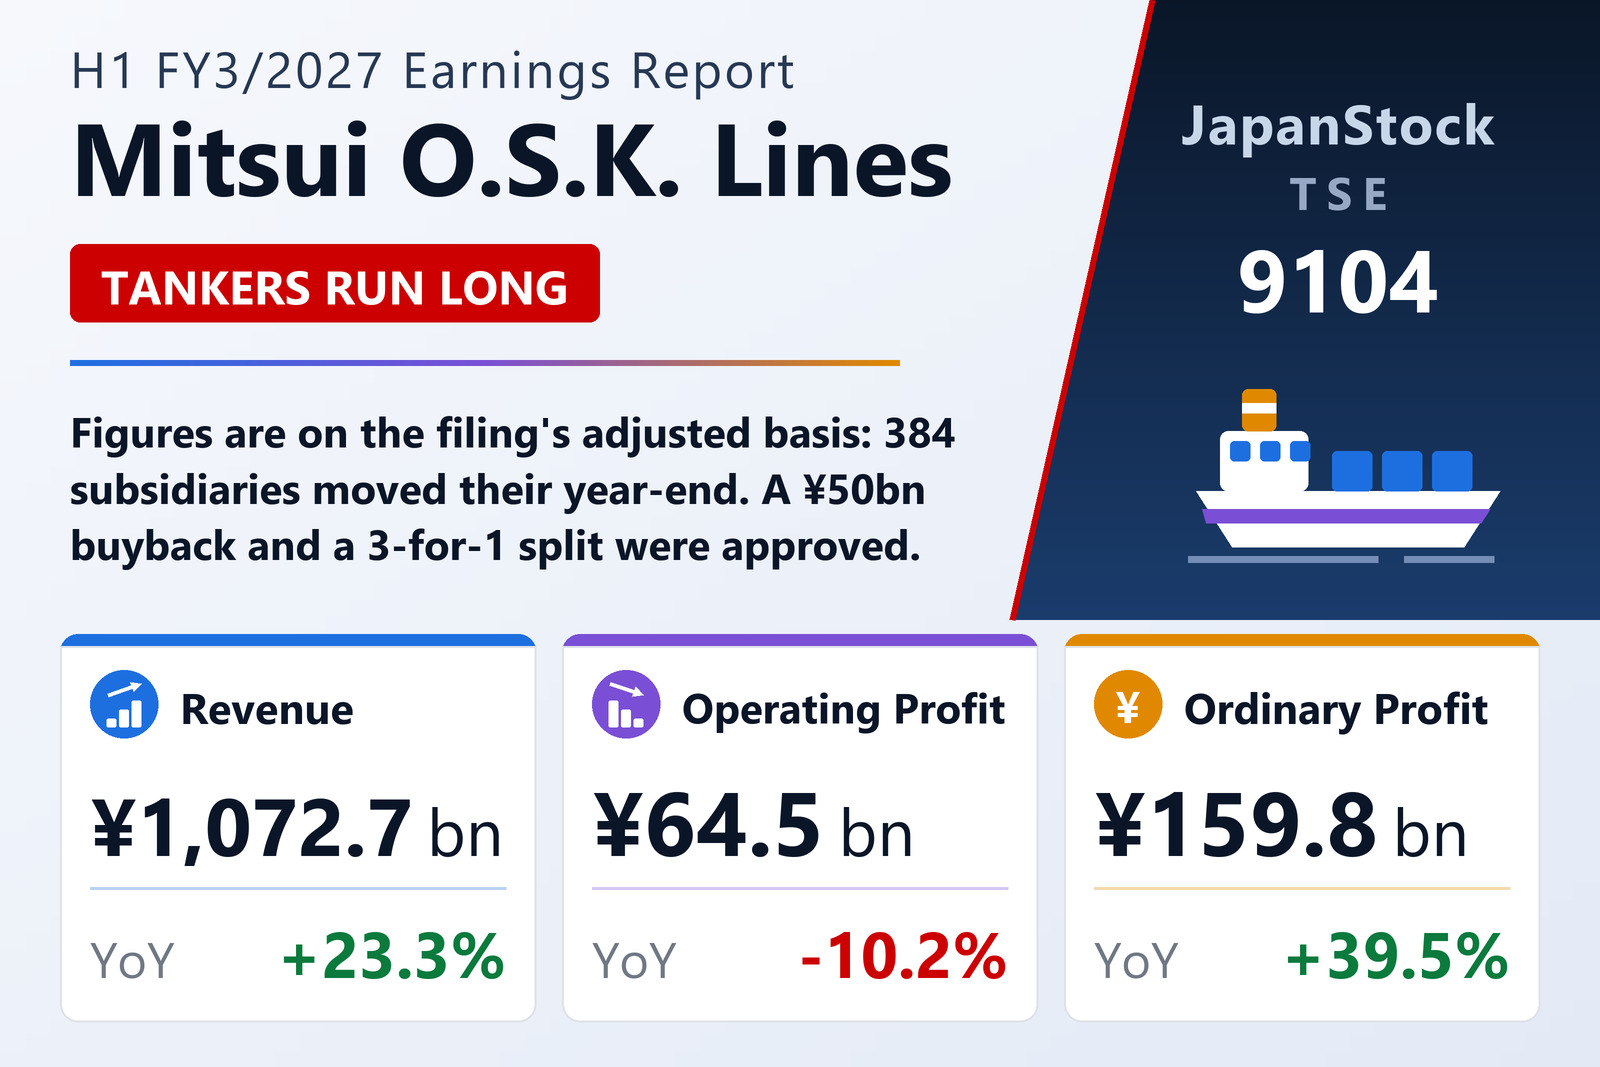
Mitsui O.S.K. Lines, Ltd. (TSE: 9104) reported consolidated results under Japanese GAAP for the first half of FY3/2027, April 1 to September 30, 2026, on November 9, 2026. From this year 384 subsidiaries that had closed their books on December 31 moved to a March year-end, so the half includes nine months of their results, January to September, and the filing prints no year-on-year changes. Restating those subsidiaries to six months, revenue rose 23.3% to ¥1,072,695 million, operating profit fell 10.2% to ¥64,484 million and ordinary profit rose 39.5% to ¥159,823 million. The yen averaged ¥160.12 to the dollar, ¥14.03 weaker than a year earlier, and bunker fuel averaged US$865 per tonne, up US$319.
Equity-method income reached ¥97,316 million, of which ¥64.1 billion came from container line Ocean Network Express. On a reported basis, dry-bulk segment profit rose to ¥19.7 billion from ¥0.1 billion as Capesize rates climbed on iron ore and bauxite shipments and slow steaming, and the energy segment grew as crude tankers ran long-haul cargoes from the Americas in place of Middle East supply and LPG carriers benefited from a shift to North American cargo. Product transport profit rose to ¥86.5 billion, while chemical logistics fell to ¥12.0 billion. Net profit was also helped by ¥20,644 million of gains on the sale of non-current assets.
Forecast unchanged after November 2 upgrade; split and buyback
MOL kept the FY3/2027 forecast it raised on November 2: revenue of ¥2,370,000 million (+29.9%), operating profit of ¥151,000 million (+18.9%), ordinary profit of ¥295,000 million (+67.8%) and net profit attributable to owners of ¥300,000 million (+40.7%), assuming the Persian Gulf and Red Sea stay closed to its ships for the full year. It paid an interim dividend of ¥100 and plans a year-end ¥105 before the split, ¥205 for the year against ¥200. The board approved a three-for-one split effective January 1, 2027, and a buyback of up to 9 million shares, 2.62% of shares outstanding, or ¥50,000 million between November 10, 2026 and March 31, 2027; the shares are to be cancelled.
| Metric | H1 FY3/2027 | H1 FY3/2026 | Change |
|---|---|---|---|
| Revenue (¥ million) | 1,275,022 | 869,772 | n.m. |
| Revenue, adjusted basis (¥ million) | 1,072,695 | 869,772 | +23.3% |
| Operating profit (¥ million) | 72,659 | 71,823 | n.m. |
| Operating profit, adjusted basis (¥ million) | 64,484 | 71,823 | -10.2% |
| Equity-method investment income (¥ million) | 97,316 | 37,838 | n.m. |
| Ordinary profit (¥ million) | 163,632 | 114,607 | n.m. |
| Ordinary profit, adjusted basis (¥ million) | 159,823 | 114,607 | +39.5% |
| Gain on sale of non-current assets (¥ million) | 20,644 | 15,601 | n.m. |
| Pre-tax profit (¥ million) | 194,288 | 134,908 | n.m. |
| Net profit attrib. to owners of parent (¥ million) | 179,313 | 116,209 | n.m. |
| EPS (¥) | 521.76 | 337.25 | n.m. |
| Comprehensive income (¥ million) | 200,821 | -14,096 | n.m. |
| Total assets (¥ million) | 6,215,406 | 5,962,245 | +4.2% |
| Net assets (¥ million) | 3,093,378 | 2,929,073 | +5.6% |
| Equity ratio | 48.9% | 48.2% | +0.7 pt |
| FY3/2027 guidance — revenue (¥ million) | 2,370,000 | — | +29.9% |
| FY3/2027 guidance — operating profit (¥ million) | 151,000 | — | +18.9% |
| FY3/2027 guidance — ordinary profit (¥ million) | 295,000 | — | +67.8% |
| FY3/2027 guidance — net profit (¥ million) | 300,000 | — | +40.7% |
| Annual dividend per share (¥) | 205.00 | 200.00 | +2.5% |
JapanStockPulse provides informational content only and does not constitute investment advice. Figures are taken from the company's published earnings short report and may be subject to subsequent revision.