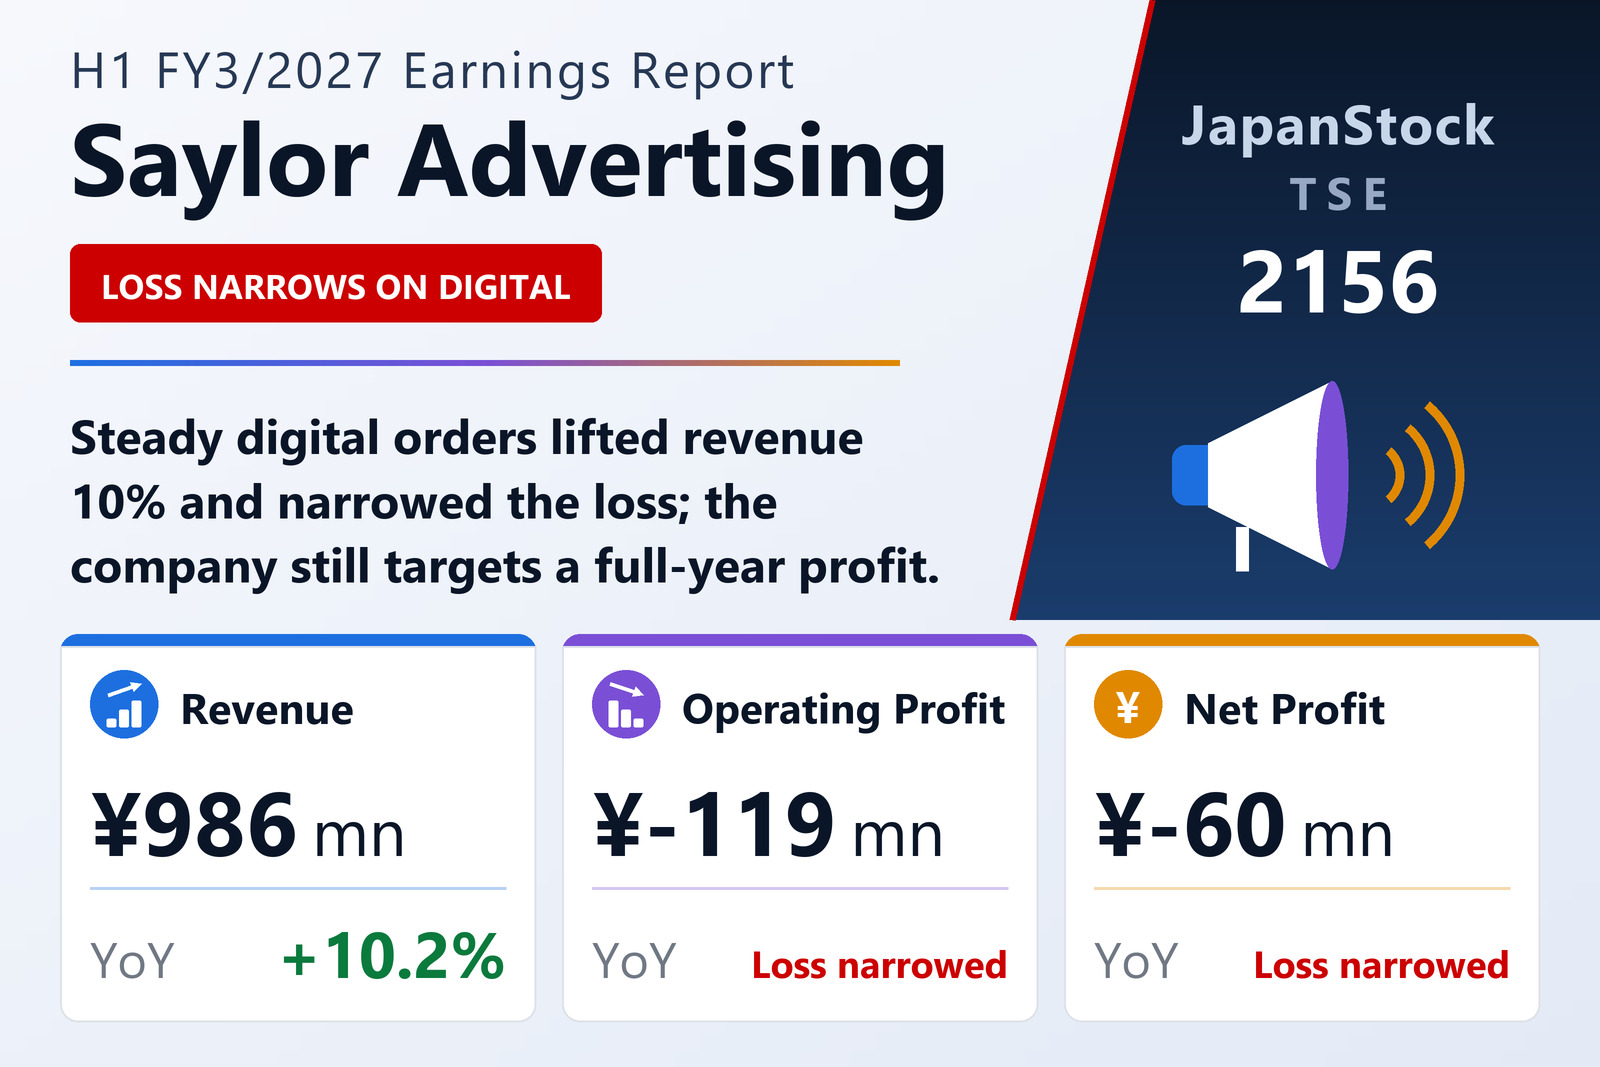
Digital work and margins improve
Saylor Advertising Inc. (TSE: 2156) reported consolidated results for the first half of FY3/2027, April 1 to September 30, 2026, on November 10, 2026. Gross sales, a non-GAAP measure of total billings, rose 4.4% to ¥3,509 million. In advertising, AI tools made proposals more efficient and orders for internet ads, website renewals and store-traffic promotions were steady; the company also worked on research and welfare facilities for local firms, sports-marketing media and public-sector proposals, and with Geotechnologies developed YukariConnect, a service that targets ads at people with a travel or stay history in a region. The retail business, including the Tokushima and Kagawa Tomoni Market regional-products shop, and software development of cloud funeral-hall booking and automated voice-response systems also performed steadily.
A focus on profitable sales lifted revenue and gross profit, which rose 8.5% to ¥755 million, with the gross margin up 0.8 points to 21.5%. Selling, general and administrative expenses rose 5.4% to ¥874 million, reflecting sales training, a corporate-website overhaul and a full period of costs at Fellow, consolidated since last October. A ¥33 million small-business subsidy for last year's regional-products sales work cut the ordinary loss to ¥73 million from ¥118 million. The equity ratio rose to 54.4%.
Full-year profit target and ¥6 dividend held
Saylor Advertising kept its FY3/2027 forecast of gross sales of ¥8,200 million (+4.3%), operating profit of ¥180 million and ordinary profit of ¥200 million, implying a profitable second half that includes a large event this autumn and preparations for an international cycling conference in Ehime next year. The year-end dividend forecast is unchanged at ¥6.
| Metric | H1 FY3/2027 | H1 FY3/2026 | Change |
|---|---|---|---|
| Gross sales (¥ million) | 3,509 | 3,360 | +4.4% |
| Revenue (¥ million) | 986 | 895 | +10.2% |
| Gross profit (¥ million) | 755 | — | +8.5% |
| SG&A expenses (¥ million) | 874 | — | +5.4% |
| Operating profit (¥ million) | -119 | -133 | loss narrowed |
| Ordinary profit (¥ million) | -73 | -118 | loss narrowed |
| Net profit attrib. to owners of parent (¥ million) | -60 | -98 | loss narrowed |
| EPS (¥) | -11.74 | -21.92 | loss narrowed |
| Total assets (¥ million) | 4,157 | 4,315 | -3.7% |
| Net assets (¥ million) | 2,263 | 2,305 | -1.8% |
| Equity ratio | 54.4% | 53.4% | +1.0 pt |
| FY3/2027 guidance — gross sales (¥ million) | 8,200 | — | +4.3% |
| FY3/2027 guidance — operating profit (¥ million) | 180 | — | loss to profit |
| FY3/2027 guidance — ordinary profit (¥ million) | 200 | — | loss to profit |
| Annual dividend per share (¥) | 6.00 | 6.00 | unchanged |
JapanStockPulse provides informational content only and does not constitute investment advice. Figures are taken from the company's published earnings short report and may be subject to subsequent revision.