Games slow, baseball and arenas grow
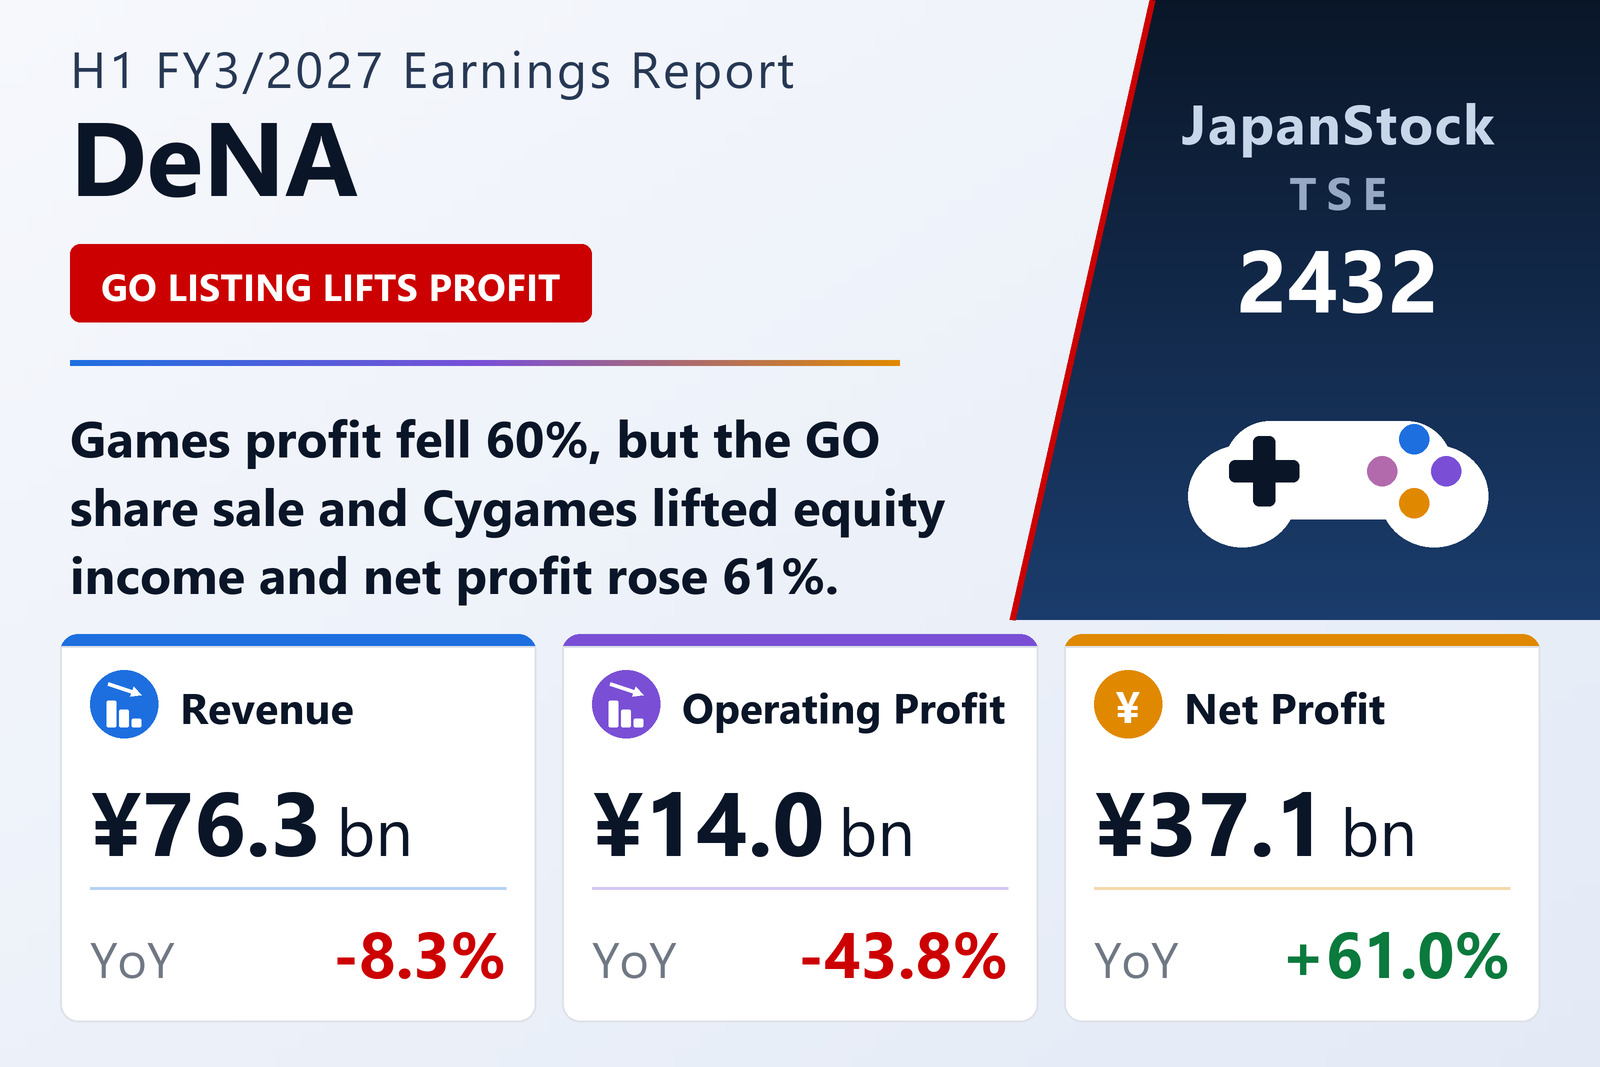
DeNA Co., Ltd. (TSE: 2432) reported consolidated results under IFRS for the first half of FY3/2027, April 1 to September 30, 2026, on November 10, 2026. Game revenue fell 28.8% to ¥23,897 million and segment profit 60.1% to ¥6,800 million, reflecting trends at Pokémon Trading Card Game Pocket. Sports & Smart City revenue rose 14.0% to ¥28,011 million and segment profit 17.4% to ¥9,855 million on strong professional baseball operations and two directly run facilities opened on March 19, 2026. Live Streaming revenue slipped 2.5% to ¥19,757 million and profit 16.0% to ¥1,903 million, with usage of Pococha and IRIAM in Japan stable.
Healthcare & Medical narrowed its loss to ¥1,450 million from ¥2,327 million as it concentrated on its Join medical communication app, while the New Businesses & Others segment, which includes AI initiatives, posted a wider loss of ¥1,156 million. Cost of sales rose 5.1% and SG&A 4.2%. GO Inc., an equity-method affiliate, listed on the TSE Growth market on June 16, 2026, when DeNA sold part of its holding in a secondary offering; together with results at Cygames this lifted equity-method income 835.6% and pushed profit before tax up 89.2% to ¥56,287 million.
Guidance held; dividend undecided
DeNA kept its FY3/2027 forecast of revenue of ¥154,000 million (+4.3%), operating profit of ¥15,000 million (-19.8%) and non-GAAP operating profit of ¥15,000 million (-46.7%). It paid no interim dividend and has not decided its year-end dividend, after ¥66 for FY3/2026. Total assets fell 7.4% to ¥308,572 million, and the equity ratio rose to 73.0%.
| Metric | H1 FY3/2027 | H1 FY3/2026 | Change |
|---|---|---|---|
| Revenue (¥ million) | 76,279 | 83,151 | -8.3% |
| Operating profit (¥ million) | 14,013 | 24,946 | -43.8% |
| Equity-method income (¥ million) | 40,792 | — | +835.6% |
| Pre-tax profit (¥ million) | 56,287 | 29,743 | +89.2% |
| Net profit attrib. to owners of parent (¥ million) | 37,072 | 23,027 | +61.0% |
| Comprehensive income (¥ million) | 39,364 | 40,244 | -2.2% |
| EPS (¥) | 382.16 | 206.60 | +85.0% |
| Game — revenue (¥ million) | 23,897 | — | -28.8% |
| Game — segment profit (¥ million) | 6,800 | — | -60.1% |
| Live Streaming — revenue (¥ million) | 19,757 | — | -2.5% |
| Live Streaming — segment profit (¥ million) | 1,903 | — | -16.0% |
| Sports & Smart City — revenue (¥ million) | 28,011 | — | +14.0% |
| Sports & Smart City — segment profit (¥ million) | 9,855 | — | +17.4% |
| Total assets (¥ million) | 308,572 | 333,244 | -7.4% |
| Equity attrib. to owners of parent (¥ million) | 225,222 | 232,622 | -3.2% |
| Equity ratio | 73.0% | 69.8% | +3.2 pt |
| FY3/2027 guidance — revenue (¥ million) | 154,000 | — | +4.3% |
| FY3/2027 guidance — operating profit (¥ million) | 15,000 | — | -19.8% |
| FY3/2027 guidance — Non-GAAP operating profit (¥ million) | 15,000 | — | -46.7% |
JapanStockPulse provides informational content only and does not constitute investment advice. Figures are taken from the company's published earnings short report and may be subject to subsequent revision.