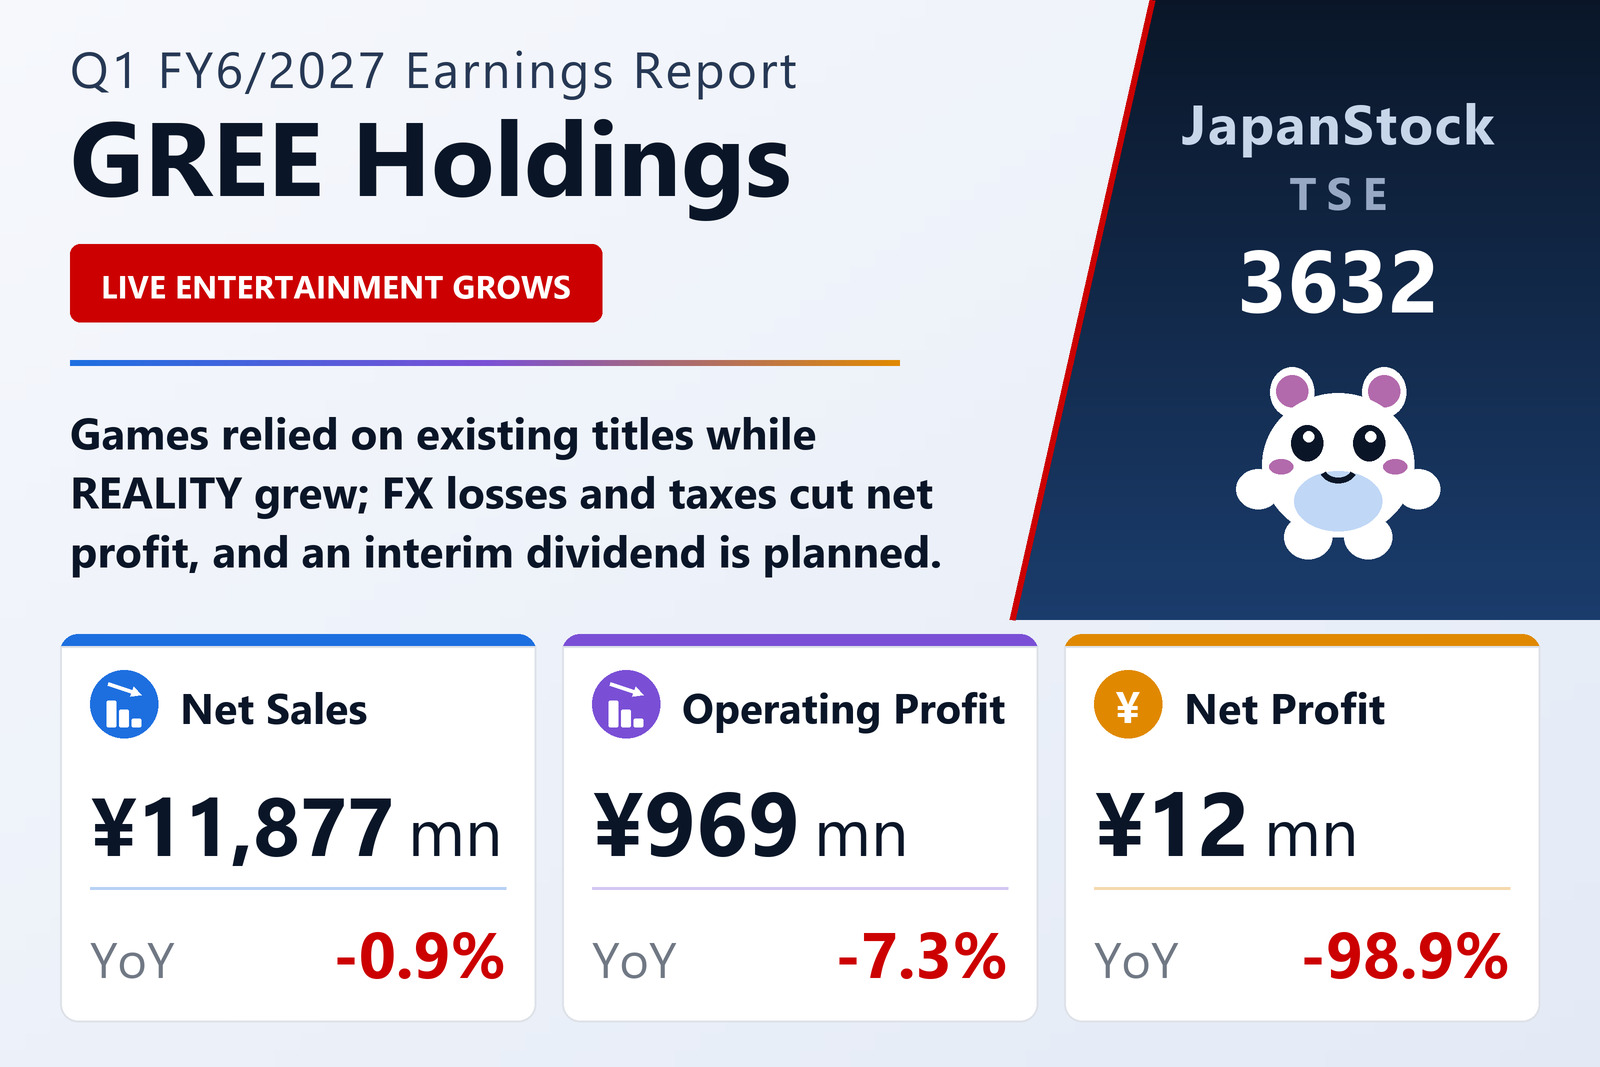
Games soft, live entertainment up
GREE Holdings, Inc. (TSE: 3632) reported consolidated results for the first quarter of FY6/2027, July 1 to September 30, 2026, on November 11, 2026. From this quarter it renamed its VTuber and IP segments Live Entertainment and Anime, Manga & MD, and abolished the Investment segment after exiting investment as a core business; prior-year figures were restated for the related accounting change. Game sales fell 6.4% to ¥7,020 million as the business was run mainly on existing titles while new ones are developed, though segment profit rose 3.2% to ¥804 million. Live Entertainment sales rose 12.0% to ¥2,385 million and profit 20.0% to ¥426 million on new content and features for REALITY and continued production investment.
Anime, Manga & MD sales rose 60.4% to ¥585 million and its loss narrowed to ¥50 million. DX sales fell 6.1% to ¥1,799 million and profit 4.2% to ¥260 million, while Engineering, which sells in-house technology to outside clients, earned ¥123 million on sales of ¥225 million. Below operating profit, a ¥242 million foreign-exchange loss replaced a ¥217 million gain a year earlier, and income taxes of ¥910 million left net profit at ¥12 million. The equity ratio was 73.0%.
Guidance held, dividend raised and split
GREE kept its FY6/2027 forecast of net sales of ¥57,000 million (+17.0%) and operating profit of ¥3,900 million (-13.6%); it does not forecast ordinary or net profit because gains and losses tied to investment activities are hard to estimate. It revised its dividend plan to pay ¥13.75 at the interim stage and ¥13.75 at year-end, for ¥27.50, against a single ¥22 for FY6/2026.
| Metric | Q1 FY6/2027 | Q1 FY6/2026 | Change |
|---|---|---|---|
| Net sales (¥ million) | 11,877 | 11,991 | -0.9% |
| Operating profit (¥ million) | 969 | 1,045 | -7.3% |
| Ordinary profit (¥ million) | 835 | 1,569 | -46.7% |
| Net profit attrib. to owners of parent (¥ million) | 12 | 1,078 | -98.9% |
| Comprehensive income (¥ million) | 273 | 857 | -68.1% |
| EPS (¥) | 0.07 | 6.29 | -98.9% |
| Game — revenue (¥ million) | 7,020 | — | -6.4% |
| Game — segment profit (¥ million) | 804 | — | +3.2% |
| Live Entertainment — revenue (¥ million) | 2,385 | — | +12.0% |
| Live Entertainment — segment profit (¥ million) | 426 | — | +20.0% |
| DX — revenue (¥ million) | 1,799 | — | -6.1% |
| DX — segment profit (¥ million) | 260 | — | -4.2% |
| Total assets (¥ million) | 125,582 | 125,547 | +0.0% |
| Net assets (¥ million) | 92,614 | 96,804 | -4.3% |
| Equity ratio | 73.0% | 75.8% | -2.8 pt |
| FY6/2027 guidance — revenue (¥ million) | 57,000 | — | +17.0% |
| FY6/2027 guidance — operating profit (¥ million) | 3,900 | — | -13.6% |
| Annual dividend per share (¥) | 27.50 | 22.00 | +25.0% |
JapanStockPulse provides informational content only and does not constitute investment advice. Figures are taken from the company's published earnings short report and may be subject to subsequent revision.