All three main businesses grow
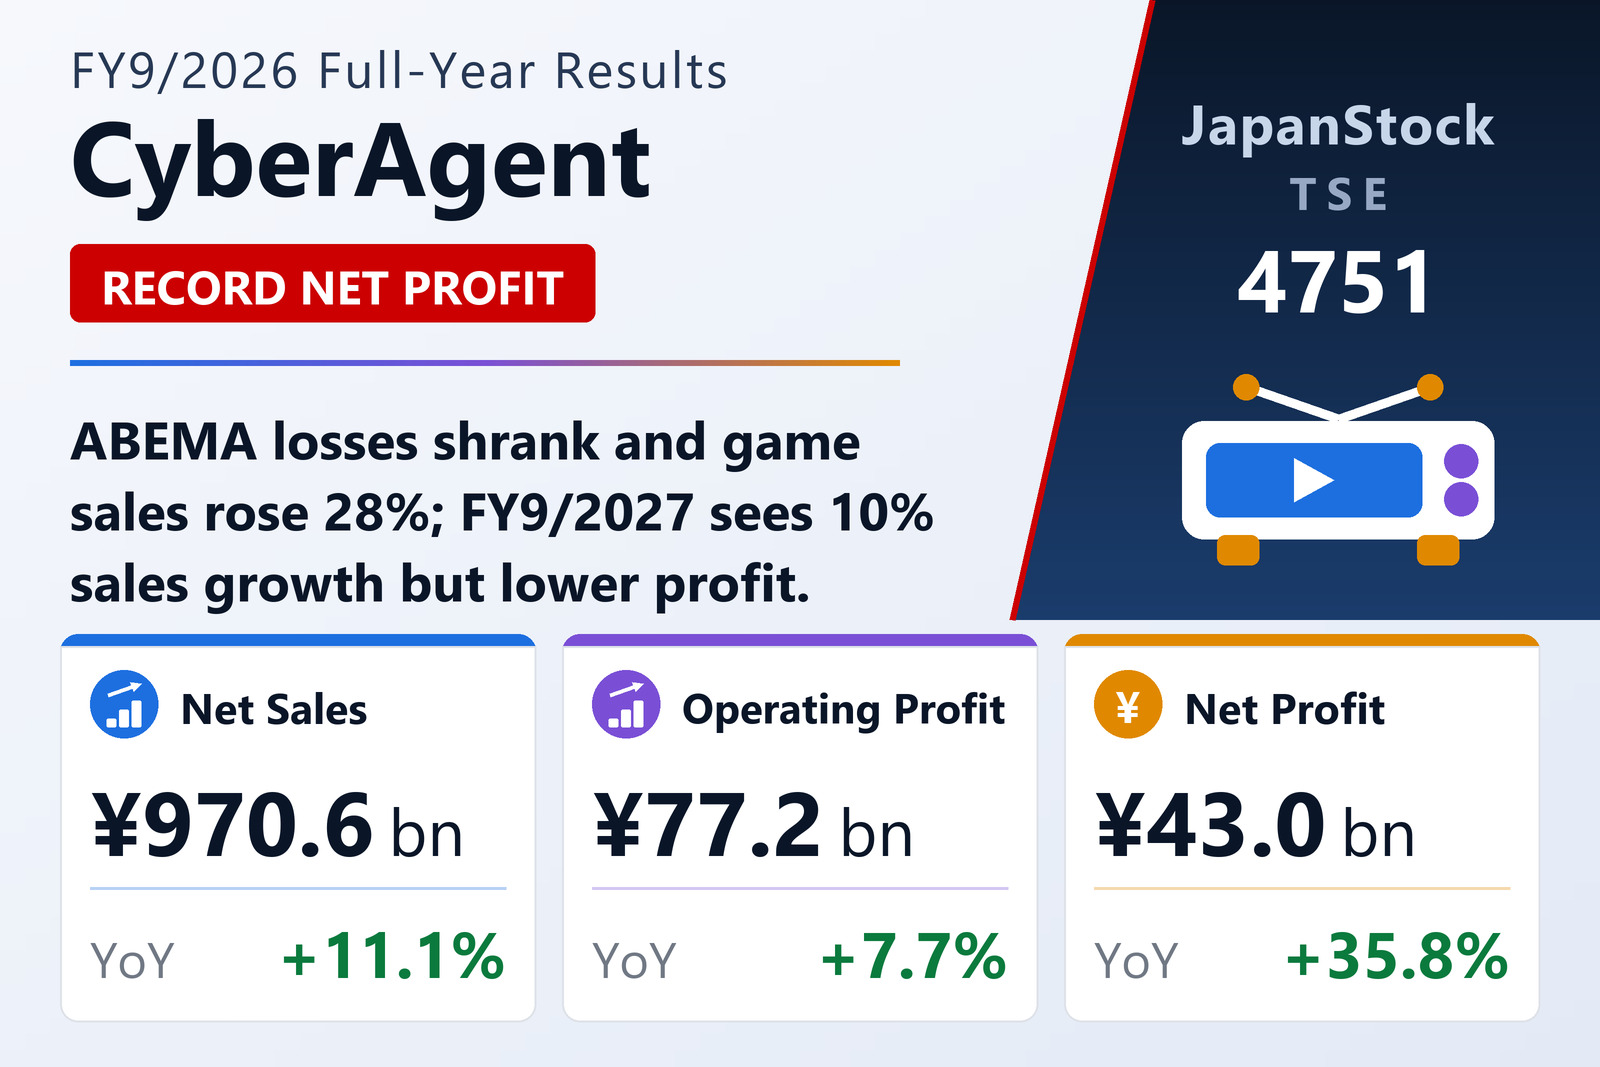
CyberAgent, Inc. (TSE: 4751) reported consolidated results for FY9/2026, October 1, 2025 to September 30, 2026, on November 11, 2026. Media & IP, which includes the ABEMA streaming service, the WINTICKET betting app and the anime and IP division, lifted sales 8.0% to ¥250,045 million and operating profit 103.0% to ¥14,804 million, helped by smaller losses at AbemaTV. Internet Advertising sales reached a record ¥487,680 million, up 5.7%, and profit rose 5.2% to ¥18,521 million despite continued AI investment. Game sales, from Cygames and other studios, jumped 28.0% to ¥277,365 million on strong flagship titles, overseas expansion and new hits, while operating profit was flat at ¥60,021 million.
The Investment Development segment posted an operating loss of ¥2,007 million on sales of ¥358 million. Ordinary profit rose 10.0% to ¥78,884 million. Operating cash flow was ¥64,676 million and investing outflows rose to ¥68,444 million, leaving cash at ¥200,834 million. Total assets rose 6.9% to ¥595,826 million, and the equity ratio rose to 35.3%. CyberAgent has now beaten its initial forecast for three straight years.
FY9/2027: double-digit sales growth, lower profit
For FY9/2027 CyberAgent forecasts net sales of ¥1,070,000 million (+10.2%), operating profit of ¥66,000 million (-14.6%), ordinary profit of ¥66,000 million and net profit attributable to owners of ¥35,000 million (-18.6%), describing the figures as what it can currently foresee. It added a target of a 20% return on equity, excluding special factors. The FY9/2026 dividend is ¥20, up from ¥17, and it plans ¥22 for FY9/2027.
| Metric | FY9/2026 | FY9/2025 | Change |
|---|---|---|---|
| Net sales (¥ million) | 970,618 | 874,030 | +11.1% |
| Operating profit (¥ million) | 77,249 | 71,702 | +7.7% |
| Ordinary profit (¥ million) | 78,884 | 71,743 | +10.0% |
| Net profit attrib. to owners of parent (¥ million) | 43,001 | 31,667 | +35.8% |
| Comprehensive income (¥ million) | 50,550 | 42,430 | +19.1% |
| EPS (¥) | 84.81 | 62.52 | +35.7% |
| Media & IP — revenue (¥ million) | 250,045 | — | +8.0% |
| Media & IP — segment profit (¥ million) | 14,804 | — | +103.0% |
| Internet Advertising — revenue (¥ million) | 487,680 | — | +5.7% |
| Internet Advertising — segment profit (¥ million) | 18,521 | — | +5.2% |
| Game — revenue (¥ million) | 277,365 | — | +28.0% |
| Game — segment profit (¥ million) | 60,021 | — | -0.1% |
| Total assets (¥ million) | 595,826 | 557,162 | +6.9% |
| Net assets (¥ million) | 300,063 | 275,681 | +8.8% |
| Equity ratio | 35.3% | 32.3% | +3.0 pt |
| FY9/2027 guidance — revenue (¥ million) | 1,070,000 | — | +10.2% |
| FY9/2027 guidance — operating profit (¥ million) | 66,000 | — | -14.6% |
| FY9/2027 guidance — ordinary profit (¥ million) | 66,000 | — | -16.3% |
| FY9/2027 guidance — net profit (¥ million) | 35,000 | — | -18.6% |
| Annual dividend per share (¥) | 22.00 | 20.00 | +10.0% |
JapanStockPulse provides informational content only and does not constitute investment advice. Figures are taken from the company's published earnings short report and may be subject to subsequent revision.