Architectural design carries the half
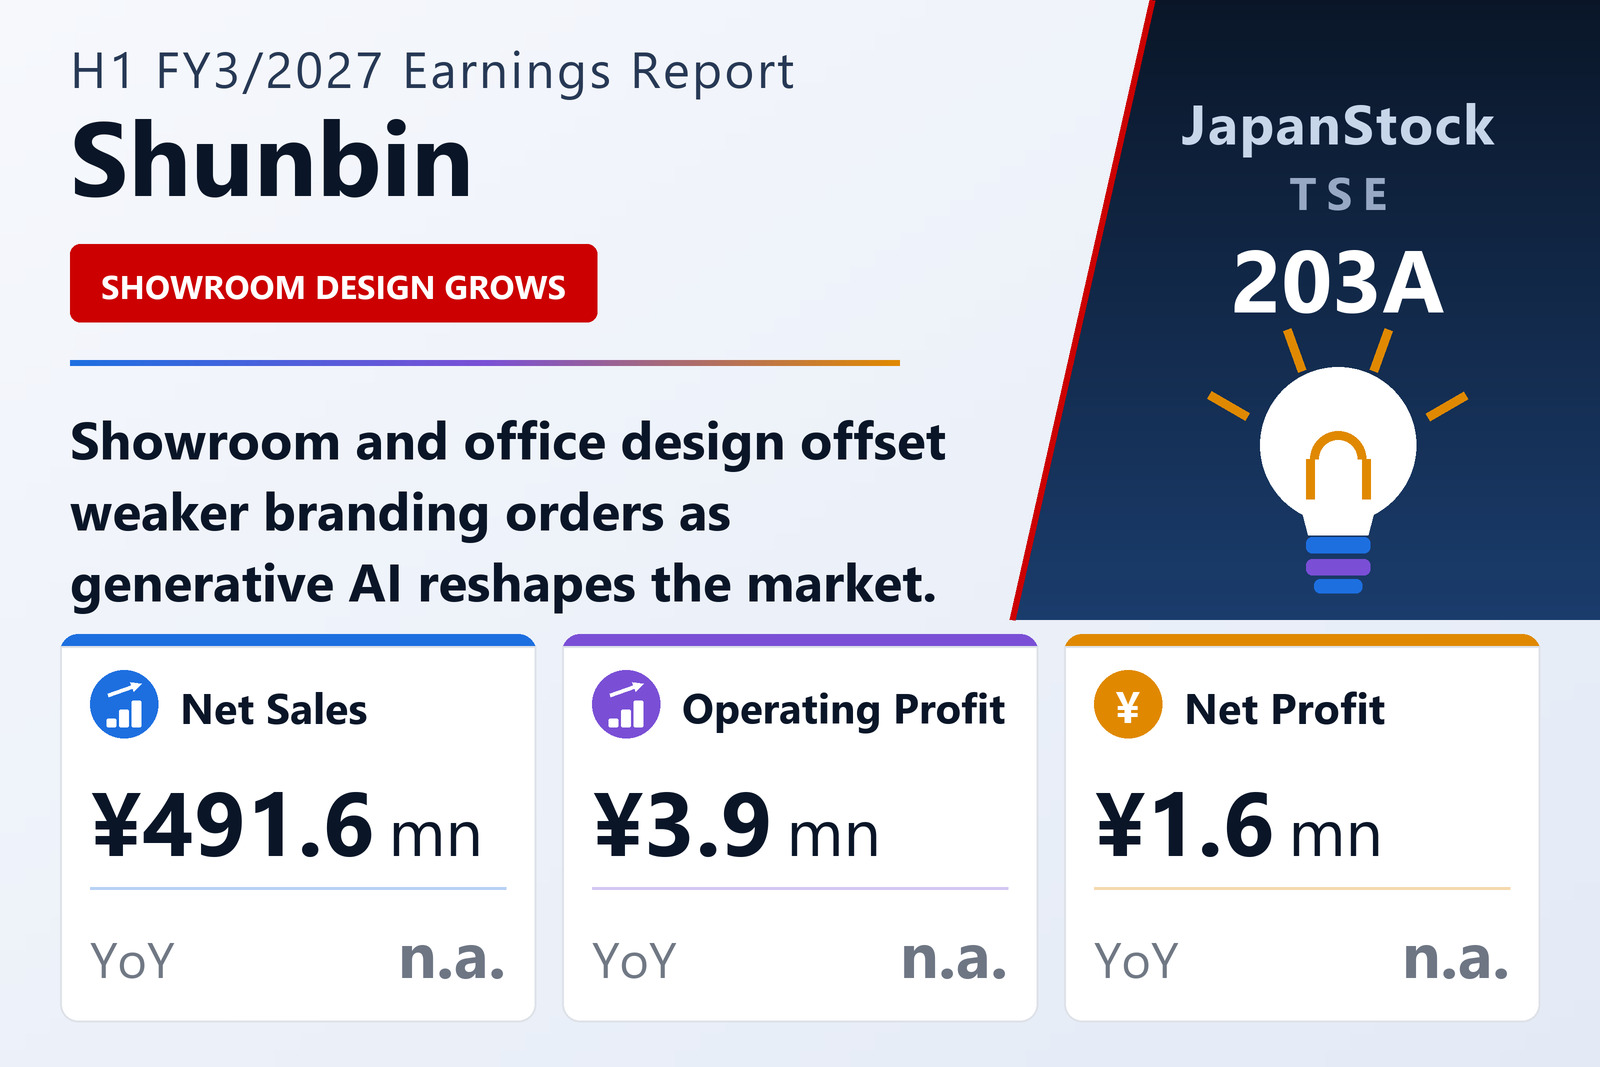
Shunbin Co., Ltd. (TSE: 203A), listed on the TOKYO PRO Market, reported non-consolidated results for the first half of FY3/2027, April 1 to September 30, 2026, on November 12, 2026. It absorbed its subsidiary Musubino on October 1, 2025 and has reported on a non-consolidated basis since FY3/2026, so no year-on-year comparison is given. Its main clients in the food and alcoholic-beverage industries faced weaker demand as price increases to cover raw-material costs curbed consumption, and the rapid spread of generative AI has upended the market for conventional branding work, where orders were sluggish.
Large projects in high-value creative work and a sharp rise in architectural design, including exhibition rooms, showrooms and offices, supported results. Shunbin has begun rebranding itself to offer what AI cannot replace, such as customers' core brand experience and the rebuilding of corporate value, with a focus on helping Japanese manufacturers show off their craftsmanship and aesthetics. It operates a single segment. Total assets fell 4.7% to ¥765 million and the equity ratio was 41.9%.
Guidance unchanged
Shunbin kept the FY3/2027 forecast it published on May 14, 2026: net sales of ¥1,083 million (+8.2%), operating profit of ¥45 million (+386.5%), ordinary profit of ¥44 million (+432.2%) and net profit of ¥29 million (+3.3%), and its year-end dividend forecast of ¥0.50, unchanged. The first half delivered 45.4% of the sales target.
| Metric | H1 FY3/2027 | H1 FY3/2026 | Change |
|---|---|---|---|
| Net sales (¥ million) | 491.6 | — | — |
| Operating profit (¥ million) | 3.9 | — | — |
| Ordinary profit (¥ million) | 2.4 | — | — |
| Net profit (¥ million) | 1.6 | — | — |
| EPS (¥) | 0.68 | — | — |
| Total assets (¥ million) | 765 | 803 | -4.7% |
| Net assets (¥ million) | 320 | 320 | +0.0% |
| Equity ratio | 41.9% | 39.9% | +2.0 pt |
| FY3/2027 guidance — revenue (¥ million) | 1,083 | — | +8.2% |
| FY3/2027 guidance — operating profit (¥ million) | 45 | — | +386.5% |
| FY3/2027 guidance — ordinary profit (¥ million) | 44 | — | +432.2% |
| FY3/2027 guidance — net profit (¥ million) | 29 | — | +3.3% |
| Annual dividend per share (¥) | 0.50 | 0.50 | unchanged |
JapanStockPulse provides informational content only and does not constitute investment advice. Figures are taken from the company's published earnings short report and may be subject to subsequent revision.