Home use down, food service up
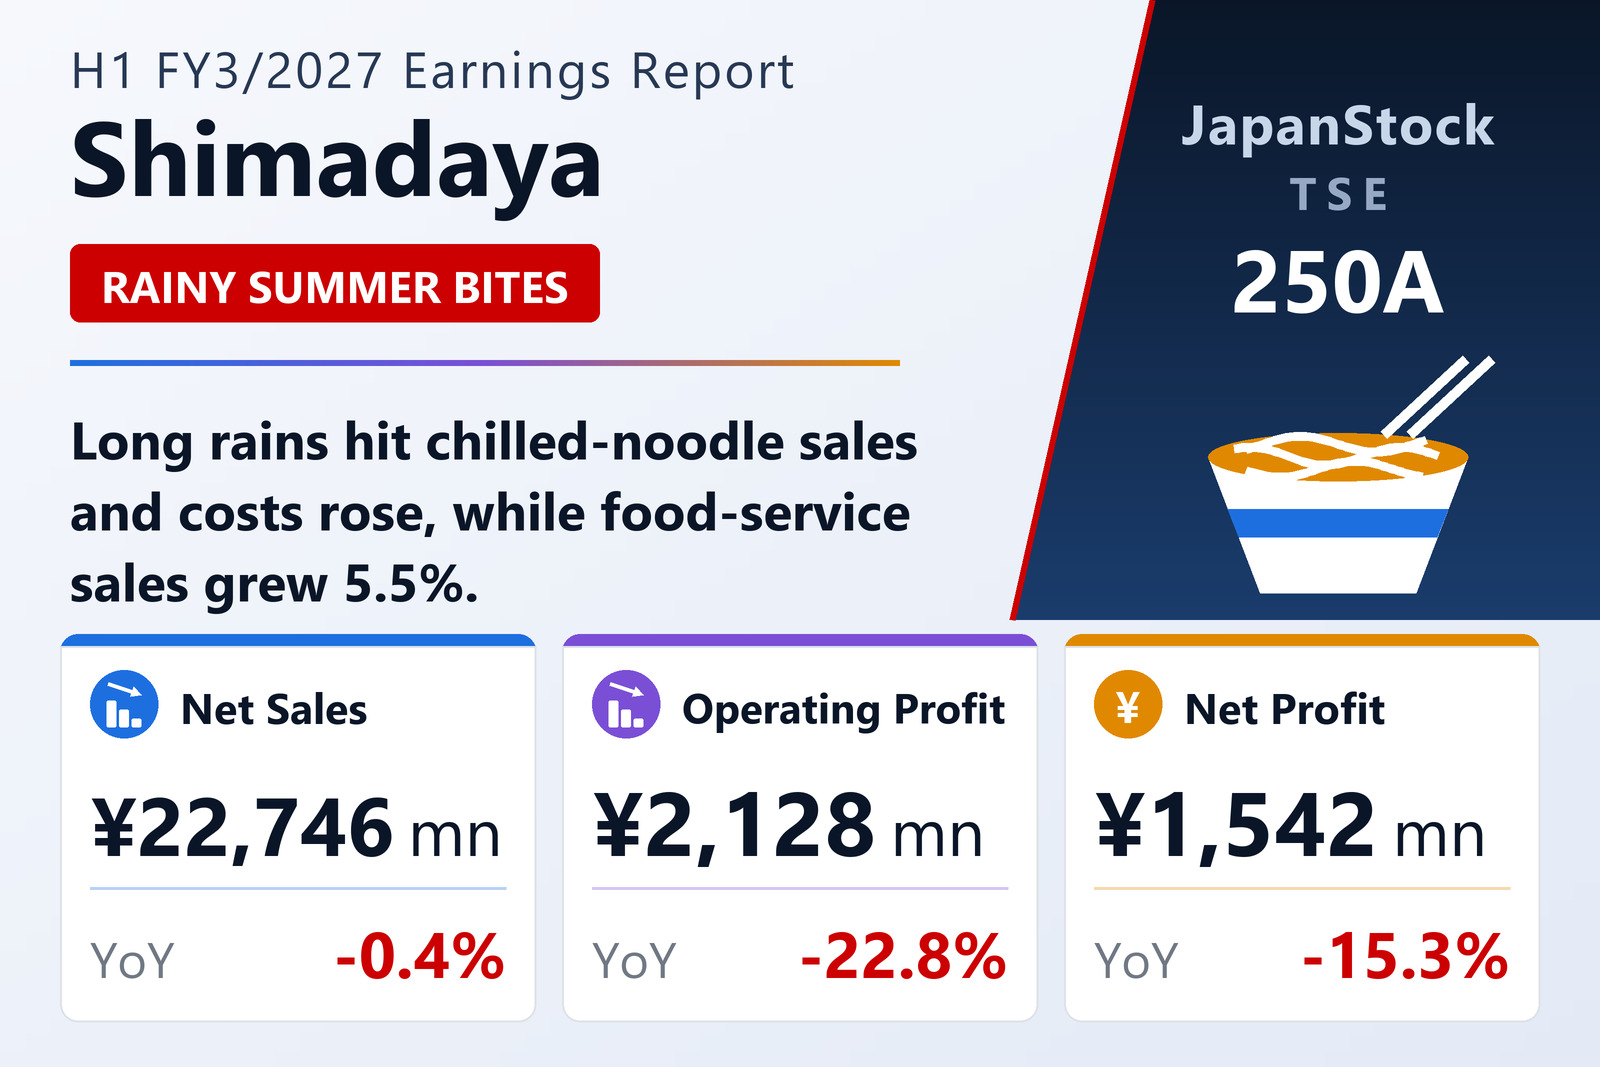
Shimadaya Corporation (TSE: 250A) reported consolidated results for the first half of FY3/2027, April 1 to September 30, 2026, on November 12, 2026, in the final year of its Change95 medium-term plan. Home-use sales fell 3.7% to ¥14,127 million: high-value brands such as Kenbimen and Shinuchi grew volumes and the budget Taikoban line sold well, particularly in western Japan, but the long rains and unseasonable weather pushed Ryusuimen and other summer noodles below last year. Food-service sales rose 5.5% to ¥8,619 million on stronger restaurant demand, new customers and expansion in Kyushu.
Cost cuts and production efficiencies were not enough to offset rising raw-material, energy and labour costs, so operating profit fell 22.8% and ordinary profit 23.1% to ¥2,175 million. The decline in net profit was smaller, at 15.3%, helped by gains on the sale of cross-shareholdings and the absence of last year's impairment loss. Total assets rose 9.0% to ¥28,336 million, mainly on higher receivables, and the equity ratio was 69.3%.
Guidance and dividend unchanged
Shimadaya kept its FY3/2027 forecast of net sales of ¥43,400 million (+5.7%), operating profit of ¥3,700 million (-1.8%), ordinary profit of ¥3,730 million and net profit attributable to owners of ¥2,600 million (+0.2%). It paid an interim dividend of ¥27 and kept its annual forecast of ¥54, up from ¥52. The first half has delivered 57.5% of the operating profit target.
| Metric | H1 FY3/2027 | H1 FY3/2026 | Change |
|---|---|---|---|
| Net sales (¥ million) | 22,746 | 22,832 | -0.4% |
| Operating profit (¥ million) | 2,128 | 2,756 | -22.8% |
| Ordinary profit (¥ million) | 2,175 | 2,827 | -23.1% |
| Net profit attrib. to owners of parent (¥ million) | 1,542 | 1,820 | -15.3% |
| Comprehensive income (¥ million) | 1,543 | 1,894 | -18.5% |
| EPS (¥) | 107.78 | 119.74 | -10.0% |
| Total assets (¥ million) | 28,336 | 26,004 | +9.0% |
| Net assets (¥ million) | 19,650 | 18,462 | +6.4% |
| Equity ratio | 69.3% | 71.0% | -1.7 pt |
| FY3/2027 guidance — revenue (¥ million) | 43,400 | — | +5.7% |
| FY3/2027 guidance — operating profit (¥ million) | 3,700 | — | -1.8% |
| FY3/2027 guidance — ordinary profit (¥ million) | 3,730 | — | -3.7% |
| FY3/2027 guidance — net profit (¥ million) | 2,600 | — | +0.2% |
| Annual dividend per share (¥) | 54.00 | 52.00 | +3.8% |
JapanStockPulse provides informational content only and does not constitute investment advice. Figures are taken from the company's published earnings short report and may be subject to subsequent revision.