Acquisition and an AI service widen the base
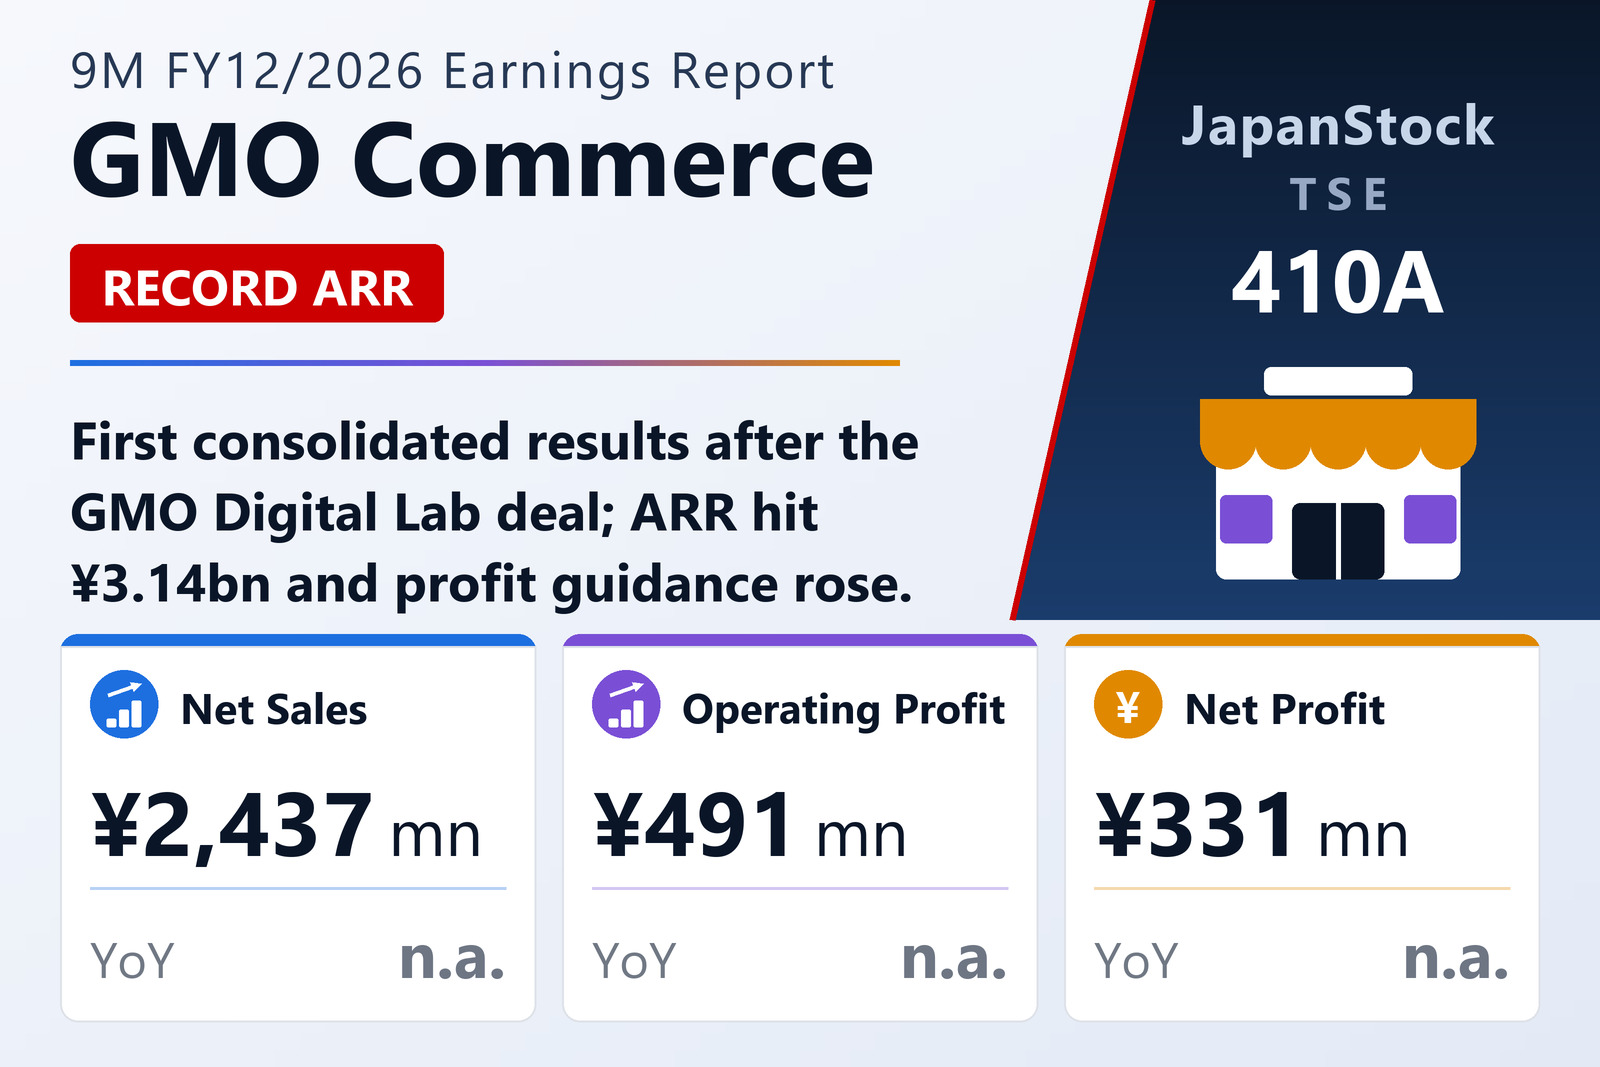
GMO Commerce, Inc. (TSE: 410A) reported results for the first nine months of FY12/2026, January 1 to September 30, 2026, on November 12, 2026. It acquired all shares of GMO Digital Lab on July 1, 2026 and moved to consolidated reporting from the third quarter, so no year-on-year comparison is given. GMO Digital Lab supports small shops and independent stores with smartphone-app marketing, complementing GMO Commerce's base of large chains. The same day it launched GMO Store AIO, which optimises stores so that generative AI services such as ChatGPT and Gemini are more likely to recommend them, and which it sees as a key growth driver.
Customer stores rose by 3,620 from the end of FY12/2025 to 20,631, on the consolidation and on new wins and wider roll-outs at existing customers. Annual recurring revenue, its leading indicator of future sales, rose to a record ¥3,139 million from ¥2,795 million at the end of the second quarter. In the July–September quarter, GMO Digital Lab's personnel costs and goodwill amortisation were added. Total assets were ¥6,784 million and the equity ratio 40.8%.
Profit forecast and dividend raised
GMO Commerce kept its FY12/2026 sales forecast at ¥5,656 million but raised operating profit by ¥10 million to ¥750 million, ordinary profit by ¥10 million to ¥740 million and net profit attributable to owners by ¥7 million to ¥447 million, citing a margin above plan. The forecast assumes GMO NIKKO and GMO Insight, consolidated on October 1, 2026, contribute in the fourth quarter. It raised its year-end dividend forecast to ¥53.01 from ¥40.30 paid last year.
| Metric | 9M FY12/2026 | 9M FY12/2025 | Change |
|---|---|---|---|
| Net sales (¥ million) | 2,437 | — | — |
| Operating profit (¥ million) | 491 | — | — |
| Ordinary profit (¥ million) | 494 | — | — |
| Net profit attrib. to owners of parent (¥ million) | 331 | — | — |
| Comprehensive income (¥ million) | 331 | — | — |
| EPS (¥) | 59.94 | — | — |
| Total assets (¥ million) | 6,784 | — | — |
| Net assets (¥ million) | 2,771 | — | — |
| Equity ratio | 40.8% | — | — |
| FY12/2026 guidance — revenue (¥ million) | 5,656 | — | — |
| FY12/2026 guidance — operating profit (¥ million) | 750 | — | — |
| FY12/2026 guidance — ordinary profit (¥ million) | 740 | — | — |
| FY12/2026 guidance — net profit (¥ million) | 447 | — | — |
| Annual dividend per share (¥) | 53.01 | 40.30 | +31.5% |
JapanStockPulse provides informational content only and does not constitute investment advice. Figures are taken from the company's published earnings short report and may be subject to subsequent revision.