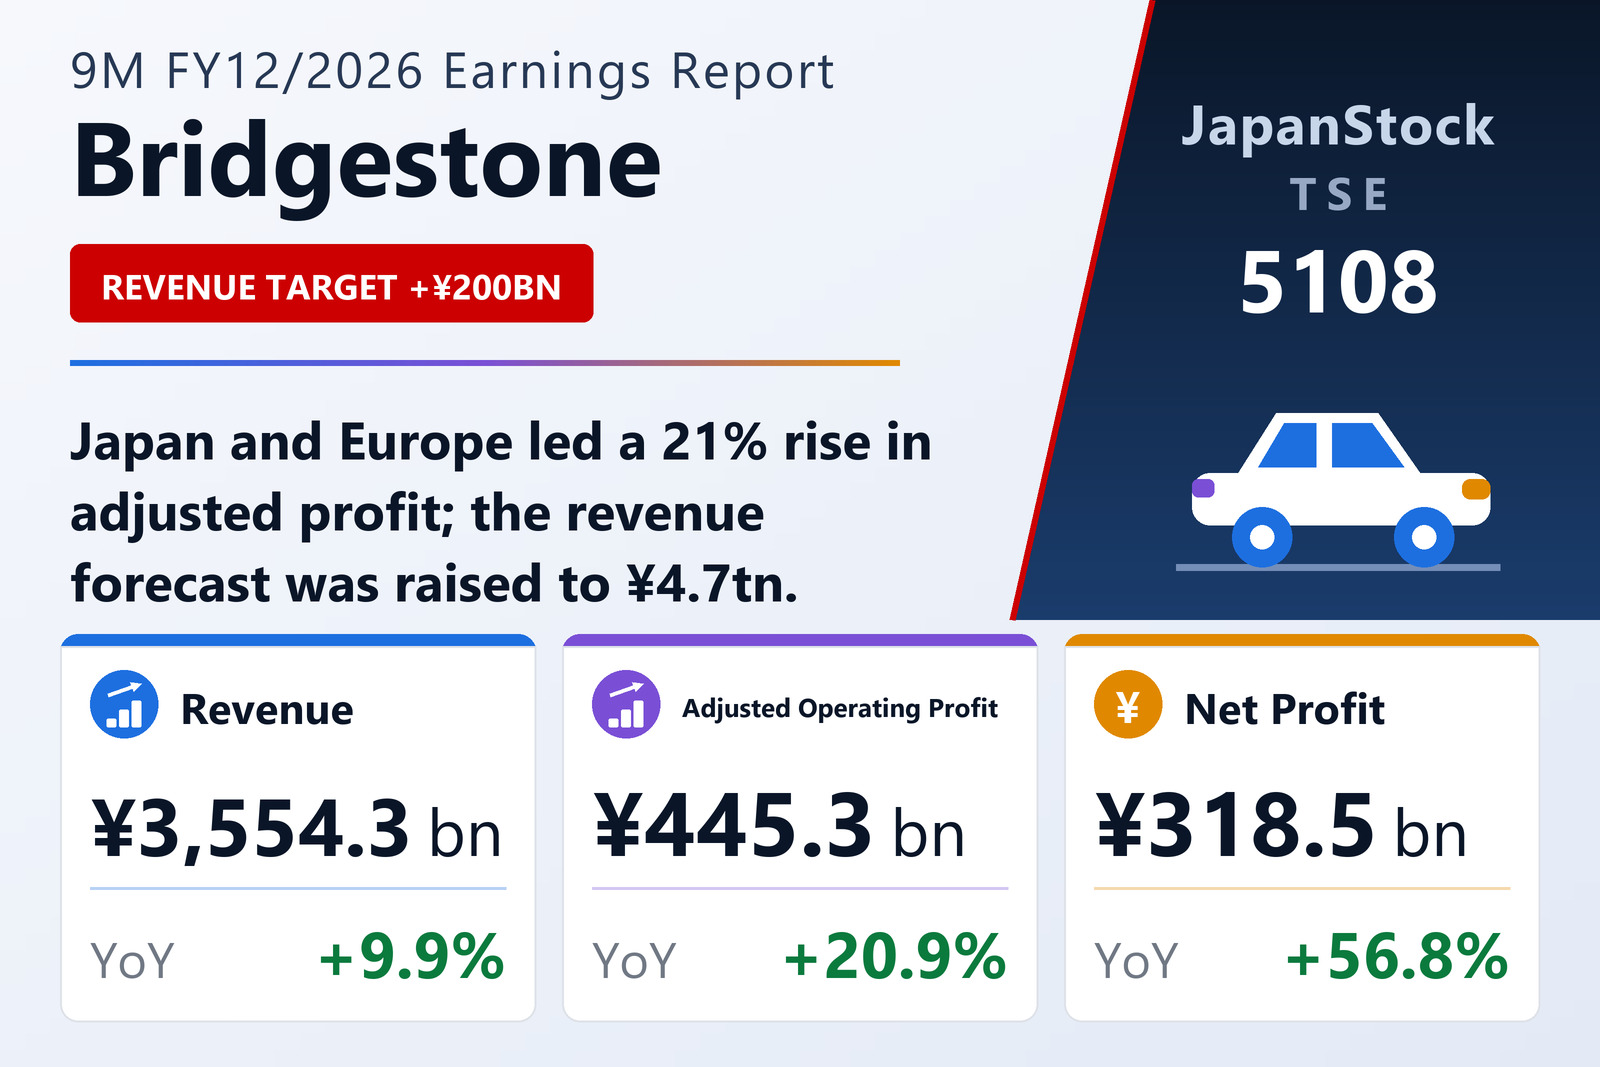
Japan and Europe lead the gains
Bridgestone Corporation (TSE: 5108) reported consolidated IFRS results for the first nine months of FY12/2026, January 1 to September 30, 2026, on November 12, 2026, excluding its anti-vibration rubber business, which is classified as discontinued. Japan raised revenue 5.9% to ¥965.5 billion and adjusted operating profit 30.2% to ¥171.6 billion, the largest contribution of any region. The Americas, its biggest market by revenue, grew sales 11.1% to ¥1,753.4 billion but held adjusted operating profit roughly flat at ¥158.2 billion. Europe, the Middle East and Africa lifted adjusted operating profit 38.5% to ¥45.8 billion, and Asia-Pacific, India and China 22.4% to ¥50.3 billion.
Operating profit rose faster than adjusted operating profit, by 51.7% to ¥442.6 billion, because adjustment items that cut operating profit by ¥76.6 billion a year earlier shrank to ¥2.7 billion. Basic earnings per share were ¥254.14, restated for the two-for-one share split on January 1, 2026. Total assets were almost unchanged at ¥5,768,136 million and the equity ratio attributable to owners was 63.8%.
Revenue forecast raised by ¥200 billion
Bridgestone raised its FY12/2026 revenue forecast to ¥4,700,000 million (+6.1%) from ¥4,500,000 million after changing its currency assumptions and reflecting the impact of the Middle East situation and its countermeasures. It kept adjusted operating profit at ¥515,000 million (+4.3%) and net profit attributable to owners at ¥340,000 million (+3.9%). The nine months have delivered 86.5% of the adjusted operating profit target. The annual dividend forecast stays at ¥125, against a split-adjusted ¥115 a year earlier.
| Metric | 9M FY12/2026 | 9M FY12/2025 | Change |
|---|---|---|---|
| Revenue (¥ million) | 3,554,288 | 3,234,926 | +9.9% |
| Adjusted operating profit (¥ million) | 445,291 | 368,367 | +20.9% |
| Operating profit (¥ million) | 442,562 | 291,723 | +51.7% |
| Net profit attrib. to owners of parent (¥ million) | 318,515 | 203,106 | +56.8% |
| Comprehensive income (¥ million) | 316,842 | 104,163 | +204.2% |
| EPS (¥) | 254.14 | 151.37 | +67.9% |
| Japan — revenue (¥ million) | 965,490 | 912,082 | +5.9% |
| Japan — adjusted operating profit (¥ million) | 171,577 | 131,785 | +30.2% |
| Asia-Pacific, India & China — revenue (¥ million) | 424,651 | 373,422 | +13.7% |
| Asia-Pacific, India & China — adjusted operating profit (¥ million) | 50,315 | 41,101 | +22.4% |
| Americas — revenue (¥ million) | 1,753,370 | 1,578,550 | +11.1% |
| Americas — adjusted operating profit (¥ million) | 158,182 | 157,837 | +0.2% |
| Europe, Middle East & Africa — revenue (¥ million) | 682,734 | 626,309 | +9.0% |
| Europe, Middle East & Africa — adjusted operating profit (¥ million) | 45,789 | 33,066 | +38.5% |
| Total assets (¥ million) | 5,768,136 | 5,747,705 | +0.4% |
| Equity attrib. to owners of parent (¥ million) | 3,677,317 | 3,661,793 | +0.4% |
| Equity ratio | 63.8% | 63.7% | +0.1 pt |
| FY12/2026 guidance — revenue (¥ million) | 4,700,000 | — | +6.1% |
| FY12/2026 guidance — adjusted operating profit (¥ million) | 515,000 | — | +4.3% |
| FY12/2026 guidance — net profit (¥ million) | 340,000 | — | +3.9% |
| Annual dividend per share (¥) | 125.00 | 115.00 | +8.7% |
JapanStockPulse provides informational content only and does not constitute investment advice. Figures are taken from the company's published earnings short report and may be subject to subsequent revision.