Growth everywhere, margin nowhere
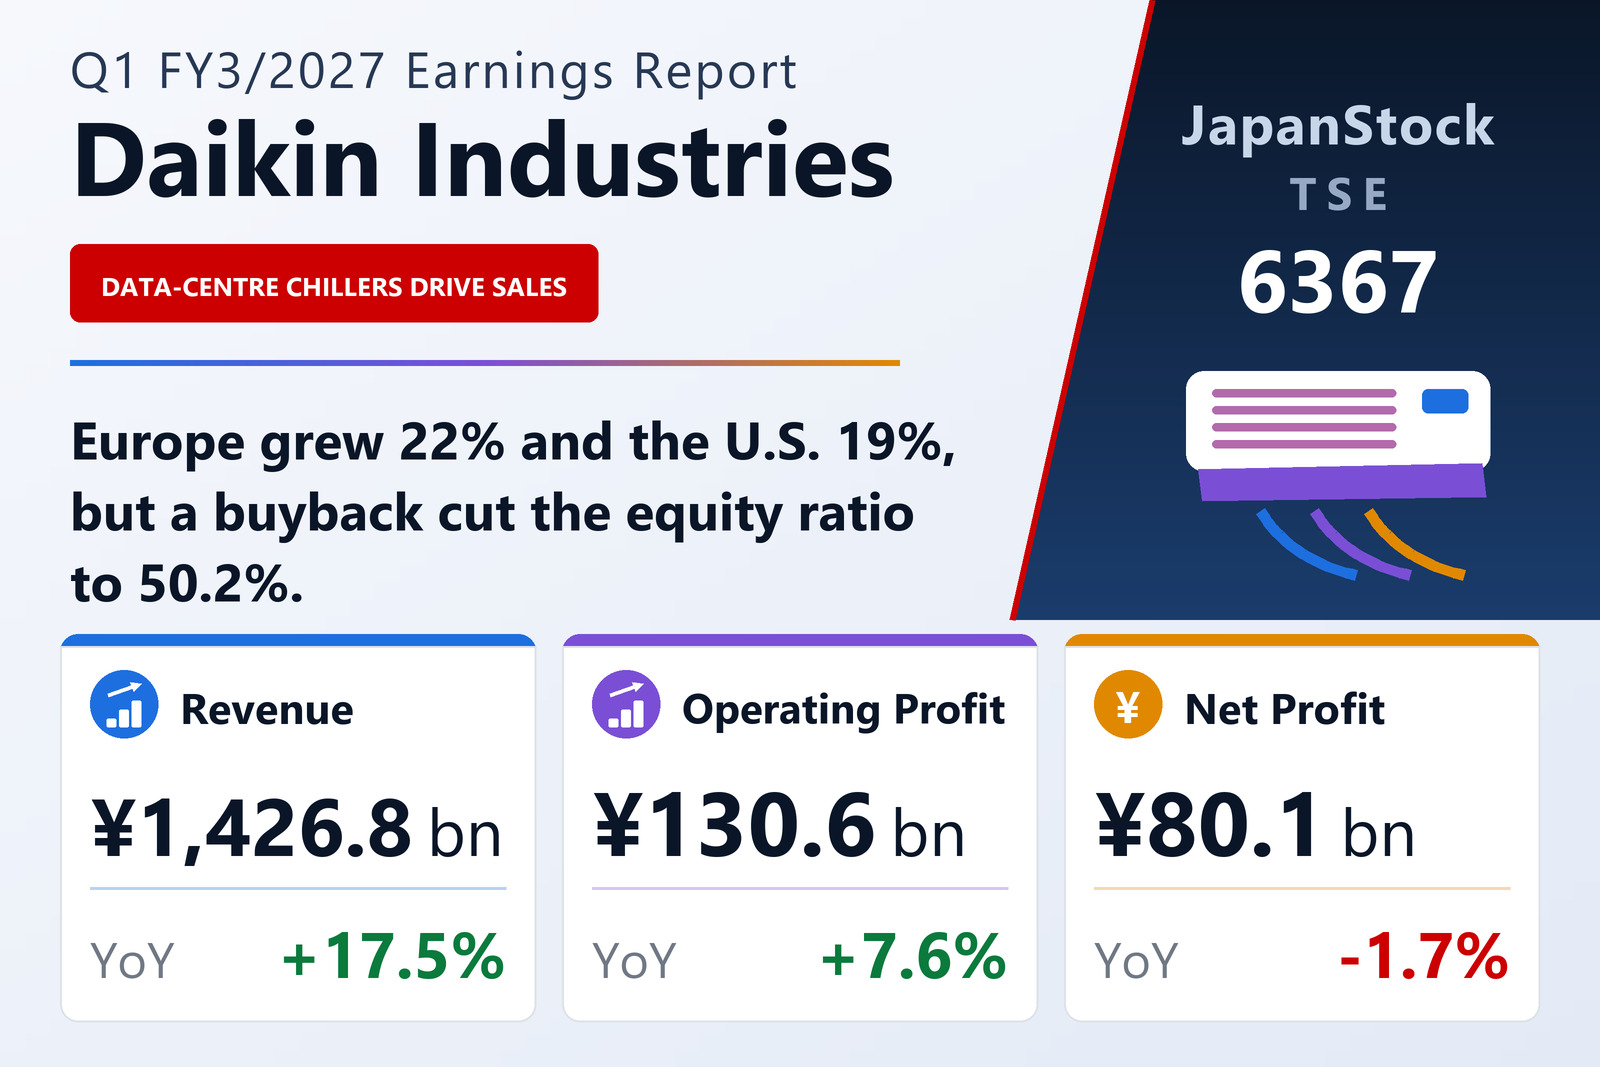
Daikin Industries, Ltd. (TSE: 6367) published consolidated first-quarter results for FY3/2027 on August 4, 2026, covering April 1 to June 30, 2026 under Japanese GAAP. Revenue rose 17.5% to ¥1,426,810 million and operating profit 7.6% to ¥130,560 million — growth in profit at less than half the rate of revenue, which pulled the operating margin down to 9.2% from 10.0%.
The gap widens further down. Ordinary profit advanced only 1.6% to ¥120,811 million, so the shortfall between operating and ordinary profit grew to ¥9,749 million from ¥2,395 million a year earlier — a period in which the group's interest-bearing debt ratio climbed to 23.8% from 18.8%. Net profit attributable to shareholders fell 1.7% to ¥80,136 million, though earnings per share still edged up 0.8% to ¥280.60 on a reduced share count.
Chillers, heatwaves and semiconductors
Air Conditioning & Refrigeration, which supplies 93% of group revenue, grew 17.0% to ¥1,325,051 million, but segment profit only 3.1% to ¥118,234 million. In the Americas, residential demand stayed subdued under tariff-driven inflation and high mortgage rates, while applied air conditioning surged: chillers and custom air-handling units sold strongly into data centres, alongside service growth and newly acquired businesses. Europe benefited from heatwaves in the second halves of May and June across France, Belgium, the Netherlands and the UK, and from a switch to heat-pump water heating as gas prices rose.
Chemicals was the profit engine in percentage terms: revenue up 28.8% to ¥77,189 million and segment profit up 75.6% to ¥11,458 million, as fluoropolymer demand recovered with semiconductors and data centres and etchants for semiconductor processes sold well. The residual Other segment — hydraulics, defence and electronic systems — grew revenue 15.9% to ¥24,569 million and lifted profit 735.7% to ¥858 million.
By region
The United States remains the single largest market at ¥527,902 million, up 18.6%. Europe grew 21.6% to ¥231,847 million and Asia & Oceania 20.5% to ¥200,821 million, the latter driven mainly by continued expansion in India. China, where the property downturn cut demand sharply, still grew 9.9% to ¥156,313 million with the help of currency effects. Japan added 15.3% to ¥217,271 million, as commercial demand held up on heat-mitigation buying and residential replacement demand was pulled forward by reports that 2027 energy-efficiency rules will raise prices.
Balance sheet and outlook
Total assets rose 2.5% to ¥5,954,253 million. Net assets fell 7.8% to ¥3,056,403 million on share repurchases, cutting the equity ratio to 50.2% from 55.9%. Operating cash flow rose ¥89,463 million to ¥153,242 million, investing outflows widened to ¥90,550 million and financing outflows to ¥103,429 million, largely on buyback payments; cash and equivalents fell ¥28,427 million over the quarter.
Guidance issued on May 12, 2026 was left unchanged: revenue of ¥5,150,000 million (+2.7%), operating profit of ¥436,000 million (+5.1%), ordinary profit of ¥414,000 million (+1.4%) and net profit of ¥278,000 million (+1.0%), for earnings per share of ¥949.32. The annual dividend forecast is ¥360.00 per share against ¥340.00 for FY3/2026.
| Metric | Q1 FY3/2027 | Q1 FY3/2026 | Change |
|---|---|---|---|
| Net sales (¥ million) | 1,426,810 | 1,213,821 | +17.5% |
| Operating profit (¥ million) | 130,560 | 121,300 | +7.6% |
| Ordinary profit (¥ million) | 120,811 | 118,905 | +1.6% |
| Net profit attrib. to owners of parent (¥ million) | 80,136 | 81,526 | -1.7% |
| Comprehensive income (¥ million) | 145,485 | 59,136 | +146.0% |
| EPS (¥) | 280.60 | 278.43 | +0.8% |
| Air Conditioning & Refrigeration — revenue (¥ million) | 1,325,051 | 1,132,679 | +17.0% |
| Air Conditioning & Refrigeration — segment profit (¥ million) | 118,234 | 114,680 | +3.1% |
| Chemicals — revenue (¥ million) | 77,189 | 59,946 | +28.8% |
| Chemicals — segment profit (¥ million) | 11,458 | 6,525 | +75.6% |
| Revenue — Japan (¥ million) | 217,271 | 188,441 | +15.3% |
| Revenue — United States (¥ million) | 527,902 | 445,230 | +18.6% |
| Revenue — Europe (¥ million) | 231,847 | 190,662 | +21.6% |
| Revenue — Asia & Oceania (¥ million) | 200,821 | 166,633 | +20.5% |
| Revenue — China (¥ million) | 156,313 | 142,228 | +9.9% |
| Revenue — other regions (¥ million) | 92,653 | 80,625 | +14.9% |
| Total assets (¥ million) | 5,954,253 | 5,809,240 | +2.5% |
| Net assets (¥ million) | 3,056,403 | 3,316,538 | -7.8% |
| Equity ratio | 50.2% | 55.9% | -5.7 pt |
| FY3/2027 guidance — revenue (¥ million) | 5,150,000 | — | +2.7% |
| FY3/2027 guidance — operating profit (¥ million) | 436,000 | — | +5.1% |
| FY3/2027 guidance — ordinary profit (¥ million) | 414,000 | — | +1.4% |
| FY3/2027 guidance — net profit (¥ million) | 278,000 | — | +1.0% |
| FY3/2027 guidance — EPS (¥) | 949.32 | — | — |
| Annual dividend per share | 360.00 | 340.00 | +5.9% |
JapanStockPulse provides informational content only and does not constitute investment advice. Figures are taken from the company's published earnings short report and may be subject to subsequent revision.