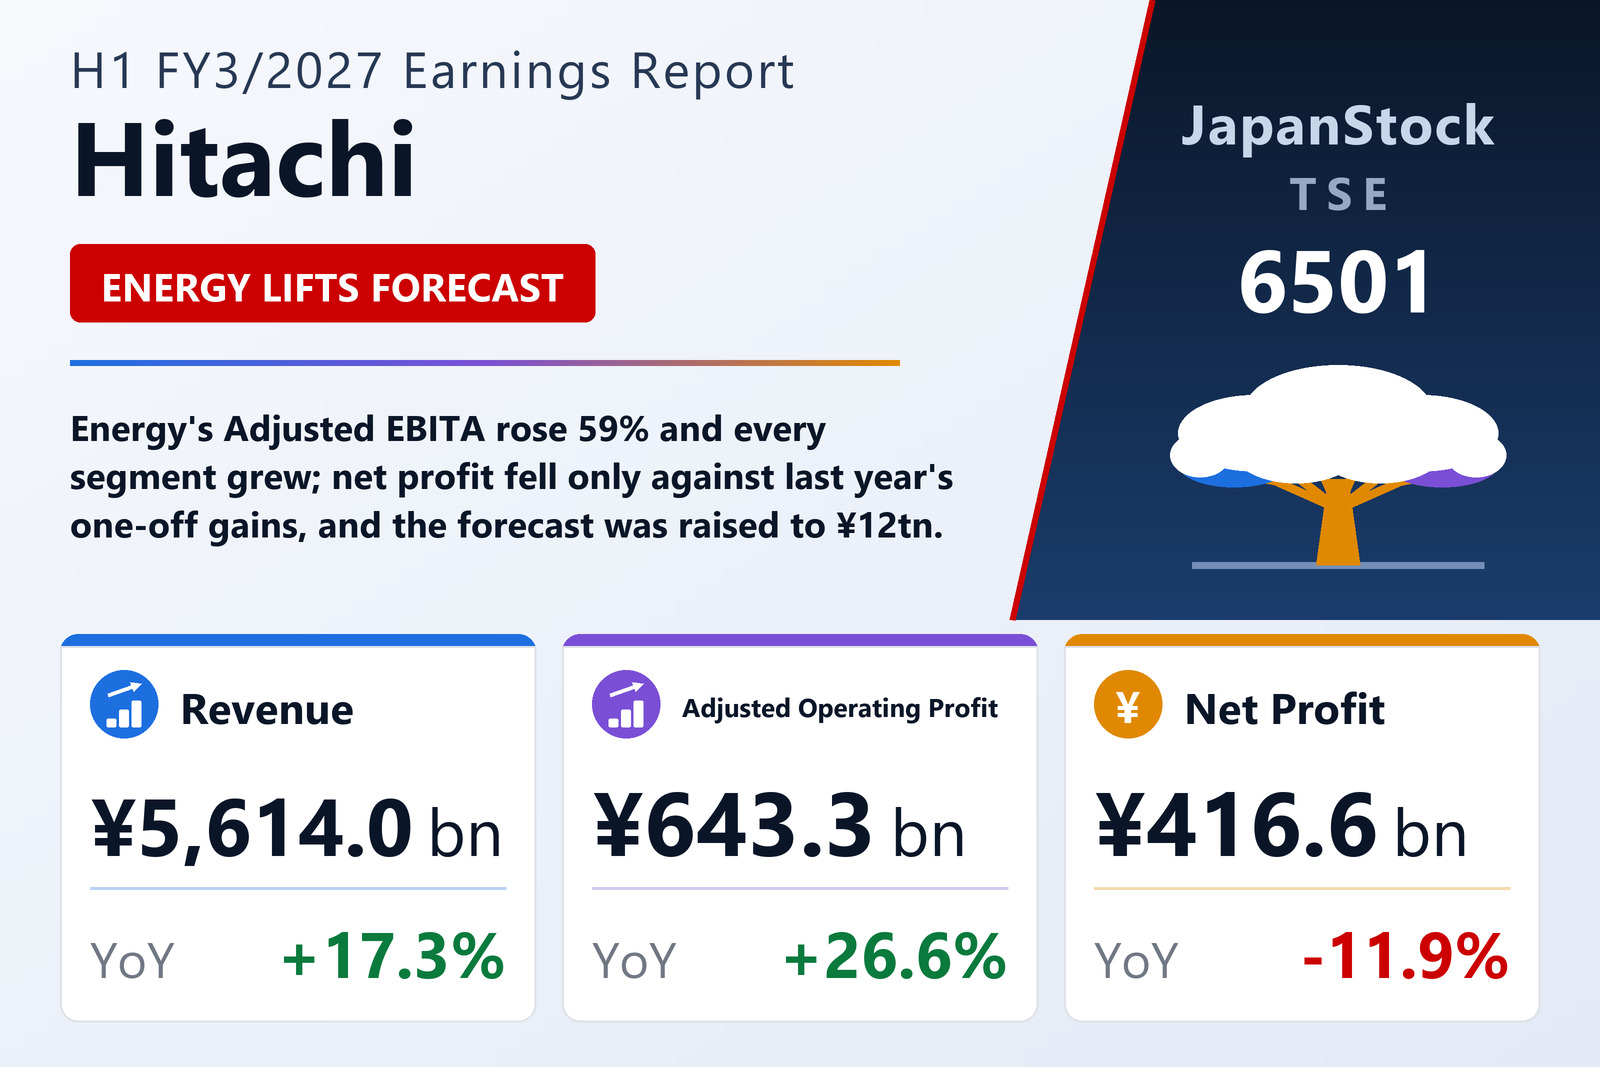
Energy leads, every segment grows
Hitachi, Ltd. (TSE: 6501) reported consolidated IFRS results for the first half of FY3/2027, April 1 to September 30, 2026, on October 28, 2026. Energy, the largest segment, grew revenue 32.0% to ¥1,872,376 million and Adjusted EBITA 59.2% to ¥274,894 million. Digital Systems & Services, which from this year also includes the industrial SI business moved from Connective Industries, grew revenue 10.3% to ¥1,533,197 million and Adjusted EBITA 11.6% to ¥211,520 million. Mobility grew revenue 18.3% to ¥692,985 million and Adjusted EBITA 37.1% to ¥55,876 million, and Connective Industries grew revenue 10.9% to ¥1,586,641 million and Adjusted EBITA 15.1% to ¥178,419 million. Overseas revenue rose 21.8% to ¥3,741,922 million, 67% of the total against 64%, with North America up 25%, Europe up 20% and Asia up 23%.
Why net profit fell
The decline below the operating line is a comparison effect. Other income fell to ¥2,630 million from ¥96,918 million and financial income to ¥22,940 million from ¥102,264 million, so pre-tax profit fell 7.4% to ¥629,934 million despite the operating gain. Basic earnings per share were ¥93.20 against ¥103.63. After the period, on October 1, 2026, Hitachi completed the sale of part of its stake in Astemo to Honda Motor for ¥152,275 million, cutting its holding to 19.0% from 40.0%; Astemo is no longer an equity-method affiliate, and Hitachi says the effect on full-year profit is not material.
Forecast and dividend raised
Total assets were ¥15,187,728 million and the stockholders' equity ratio was 43.0% against 43.7%. Hitachi raised its FY3/2027 forecast for the second time this year: revenue of ¥12,000,000 million (+13.3%) from ¥11,700,000 million, adjusted operating profit of ¥1,450,000 million (+20.9%) from ¥1,408,000 million, Adjusted EBITA of ¥1,560,000 million (+19.0%) from ¥1,520,000 million, pre-tax profit of ¥1,370,000 million (+7.6%) and net profit attributable to stockholders of ¥920,000 million (+14.7%) from ¥900,000 million, for earnings per share of ¥206.41. The interim dividend was raised to ¥32 from the ¥28 previously planned, against ¥23 a year earlier; the year-end dividend remains undecided.
| Metric | H1 FY3/2027 | H1 FY3/2026 | Change |
|---|---|---|---|
| Revenue (¥ million) | 5,614,028 | 4,787,406 | +17.3% |
| Gross profit (¥ million) | 1,690,977 | 1,425,844 | +18.6% |
| SG&A expenses (¥ million) | 1,047,717 | 917,801 | +14.2% |
| Adjusted operating profit (¥ million) | 643,260 | 508,043 | +26.6% |
| Adjusted operating margin | 11.5% | 10.6% | +0.9 pt |
| Adjusted EBITA (¥ million) | 699,651 | 561,803 | +24.5% |
| Financial income (¥ million) | 22,940 | 102,264 | -77.6% |
| Pre-tax profit (¥ million) | 629,934 | 680,169 | -7.4% |
| Net profit attrib. to owners of parent (¥ million) | 416,621 | 472,862 | -11.9% |
| EPS (¥) | 93.20 | 103.63 | -10.1% |
| Digital Systems & Services — revenue (¥ million) | 1,533,197 | 1,389,785 | +10.3% |
| Digital Systems & Services — Adjusted EBITA (¥ million) | 211,520 | 189,584 | +11.6% |
| Energy — revenue (¥ million) | 1,872,376 | 1,418,382 | +32.0% |
| Energy — Adjusted EBITA (¥ million) | 274,894 | 172,722 | +59.2% |
| Mobility — revenue (¥ million) | 692,985 | 585,702 | +18.3% |
| Mobility — Adjusted EBITA (¥ million) | 55,876 | 40,747 | +37.1% |
| Connective Industries — revenue (¥ million) | 1,586,641 | 1,430,084 | +10.9% |
| Connective Industries — Adjusted EBITA (¥ million) | 178,419 | 155,036 | +15.1% |
| Overseas revenue (¥ million) | 3,741,922 | 3,072,443 | +21.8% |
| Total assets (¥ million) | 15,187,728 | 15,041,246 | +1.0% |
| Equity attrib. to owners of parent (¥ million) | 6,525,399 | 6,568,369 | -0.7% |
| Equity ratio | 43.0% | 43.7% | -0.7 pt |
| FY3/2027 guidance — revenue (¥ million) | 12,000,000 | — | +13.3% |
| FY3/2027 guidance — adjusted operating profit (¥ million) | 1,450,000 | — | +20.9% |
| FY3/2027 guidance — pre-tax profit (¥ million) | 1,370,000 | — | +7.6% |
| FY3/2027 guidance — net profit (¥ million) | 920,000 | — | +14.7% |
| FY3/2027 guidance — EPS (¥) | 206.41 | — | — |
| Interim dividend per share (¥) | 32.00 | 23.00 | +39.1% |
JapanStockPulse provides informational content only and does not constitute investment advice. Figures are taken from the company's published earnings short report and may be subject to subsequent revision.