CSG joins, Social Infrastructure surges
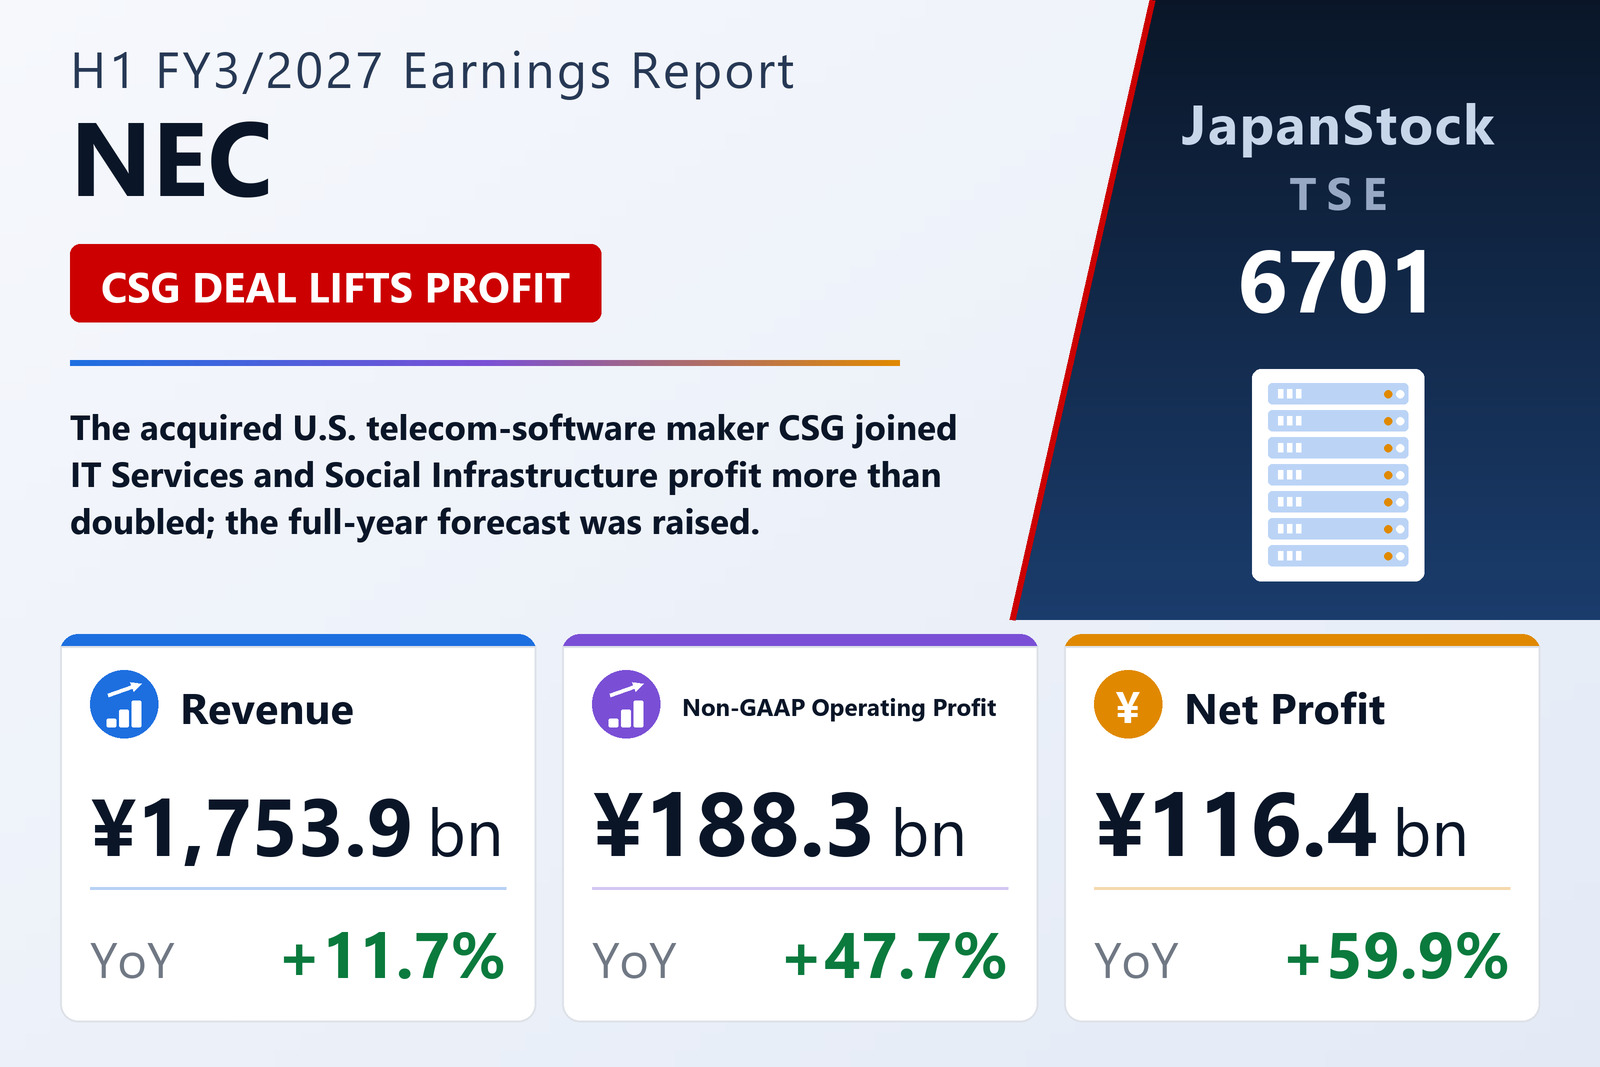
NEC Corporation (TSE: 6701) reported consolidated IFRS results for the first half of FY3/2027, April 1 to September 30, 2026, on October 28, 2026. On May 14 it completed the acquisition of CSG Systems International, Inc., a U.S. provider of billing and customer-experience software to telecom and broadband operators, for ¥360,841 million in cash, to be run together with its subsidiary Netcracker; the deal brought 47 companies into consolidation. IT Services, which now also holds domestic telecom-carrier IT services and Netcracker, grew revenue 9.6% to ¥1,331,950 million and Non-GAAP segment profit 30.1% to ¥160,373 million. Social Infrastructure grew revenue 20.4% to ¥357,940 million and more than doubled segment profit, up 164.2% to ¥36,372 million from ¥13,765 million. Overseas revenue rose sharply in North and Latin America to ¥122,806 million and in Europe, the Middle East and Africa to ¥225,224 million.
From Non-GAAP to IFRS
The gap between the two operating measures widened: structural-reform costs and impairment losses rose to ¥23,020 million from ¥1,557 million, amortisation of acquired intangibles was ¥11,549 million and M&A-related costs ¥7,717 million. Pre-tax profit still rose 23.2% to ¥142,198 million, and Non-GAAP net profit attributable to owners rose 86.7% to ¥146,708 million. Basic earnings per share were ¥87.78 against ¥54.65, while comprehensive income fell 35.9% to ¥81,161 million. From this half NEC reports only Non-GAAP operating profit, both for the group and for segments.
Forecast raised, dividend plan unchanged
Total assets rose 3.9% to ¥4,638,930 million, with goodwill up to ¥824,176 million from ¥450,501 million after the CSG purchase, and the owners' equity ratio was 48.6% against 49.2%. NEC raised its FY3/2027 forecast to revenue of ¥3,740,000 million (+4.4%) from ¥3,540,000 million, Non-GAAP operating profit of ¥460,000 million (+15.8%) from ¥430,000 million and Non-GAAP net profit of ¥310,000 million (+10.8%) from ¥290,000 million, for Non-GAAP earnings per share of ¥233.53. It paid an interim dividend of ¥20 and plans ¥20 at year end, for an annual ¥40 against ¥38.
| Metric | H1 FY3/2027 | H1 FY3/2026 | Change |
|---|---|---|---|
| Revenue (¥ million) | 1,753,857 | 1,569,779 | +11.7% |
| Operating profit (¥ million) | 146,154 | 118,570 | +23.3% |
| Non-GAAP operating profit (¥ million) | 188,298 | 127,489 | +47.7% |
| Pre-tax profit (¥ million) | 142,198 | 115,434 | +23.2% |
| Net profit attrib. to owners of parent (¥ million) | 116,439 | 72,830 | +59.9% |
| Non-GAAP net profit attrib. to owners of parent (¥ million) | 146,708 | 78,562 | +86.7% |
| Comprehensive income (¥ million) | 81,161 | 126,707 | -35.9% |
| EPS (¥) | 87.78 | 54.65 | +60.6% |
| IT Services — revenue (¥ million) | 1,331,950 | 1,215,683 | +9.6% |
| IT Services — segment profit (¥ million) | 160,373 | 123,251 | +30.1% |
| Social Infrastructure — revenue (¥ million) | 357,940 | 297,346 | +20.4% |
| Social Infrastructure — segment profit (¥ million) | 36,372 | 13,765 | +164.2% |
| Total assets (¥ million) | 4,638,930 | 4,466,784 | +3.9% |
| Equity attrib. to owners of parent (¥ million) | 2,253,990 | 2,196,578 | +2.6% |
| Equity ratio | 48.6% | 49.2% | -0.6 pt |
| FY3/2027 guidance — revenue (¥ million) | 3,740,000 | — | +4.4% |
| FY3/2027 guidance — Non-GAAP operating profit (¥ million) | 460,000 | — | +15.8% |
| Annual dividend per share (¥) | 40.00 | 38.00 | +5.3% |
JapanStockPulse provides informational content only and does not constitute investment advice. Figures are taken from the company's published earnings short report and may be subject to subsequent revision.