Gastroenterology leads, charges fall
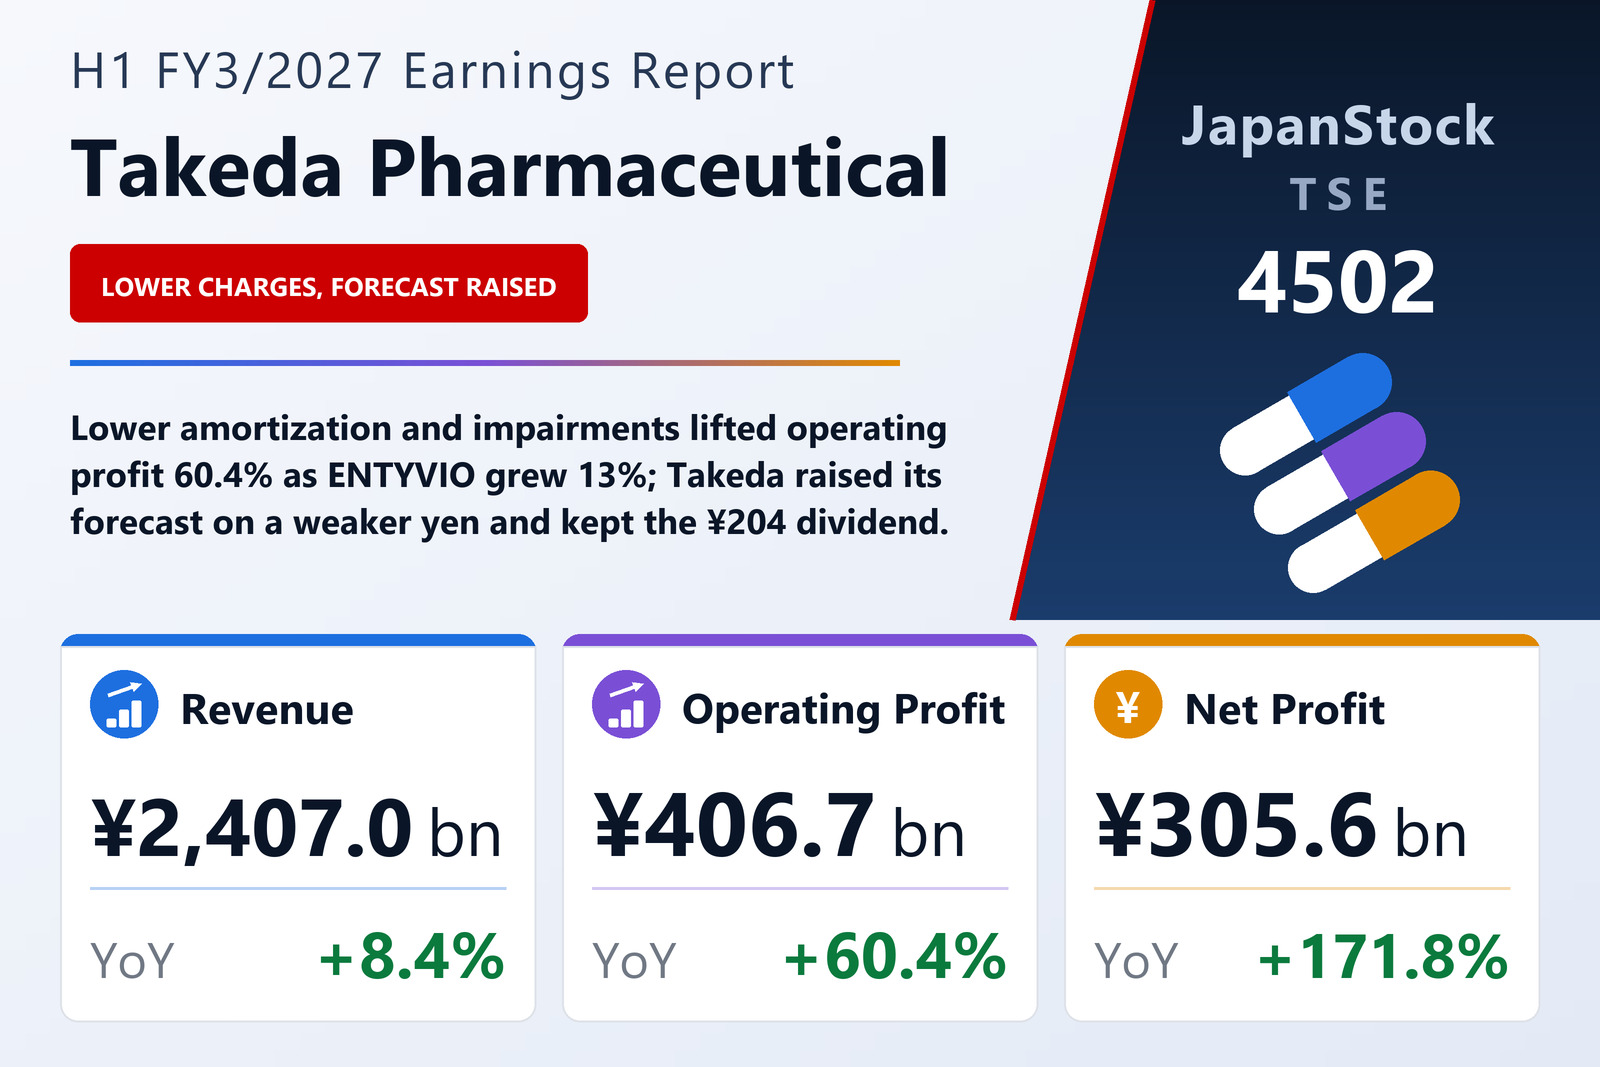
Takeda Pharmaceutical Company Limited (TSE: 4502) reported consolidated IFRS results for the first half of FY3/2027, April 1 to September 30, 2026, on October 29, 2026. Gastroenterology revenue rose 12.1% to ¥776.8 billion, led by ENTYVIO for ulcerative colitis and Crohn's disease, up 13.0% to ¥541.7 billion as the subcutaneous form gained patients in the U.S. and Europe. Plasma-derived therapies grew 8.5% to ¥561.2 billion, oncology 10.1% to ¥317.0 billion and rare diseases 4.0% to ¥395.7 billion. Amortization and impairment of product intangibles fell 35.1% to ¥218.5 billion: amortization for VYVANSE ended, and the prior year had included a ¥58.2 billion impairment after Takeda dropped its gamma-delta T-cell therapy platform. Restructuring costs under the transformation program rose ¥52.4 billion, and R&D spending grew 10.9% to ¥338.6 billion. Income tax expense fell 80.4% to ¥13.0 billion, which lifted net profit; basic earnings per share were ¥192.53 against ¥71.57, and Core EPS ¥308 against ¥279.
Forecast raised on the yen
Takeda raised its FY3/2027 forecast, now assuming ¥158 to the dollar: revenue to ¥4,700,000 million from ¥4,640,000 million, operating profit to ¥453,000 million, pre-tax profit to ¥270,000 million from ¥252,000 million and profit attributable to owners to ¥209,000 million from ¥166,000 million, for earnings per share of ¥131.28. Core operating profit is now seen at ¥1,190,000 million against ¥1,160,000 million and Core EPS at ¥482 against ¥472. At constant exchange rates, Takeda now guides for a mid-single-digit percentage fall in Core operating profit, from a 5% to 8% fall. The annual dividend of ¥204, including ¥102 at the half year, is unchanged. The owners' equity ratio was 48.6% against 47.9%.
| Metric | H1 FY3/2027 | H1 FY3/2026 | Change |
|---|---|---|---|
| Revenue (¥ million) | 2,406,997 | 2,219,481 | +8.4% |
| Core operating profit (¥ billion) | 710.6 | 639.2 | +11.2% |
| Operating profit (¥ million) | 406,739 | 253,561 | +60.4% |
| Pre-tax profit (¥ million) | 318,688 | 178,804 | +78.2% |
| Net profit attrib. to owners of parent (¥ million) | 305,626 | 112,441 | +171.8% |
| Comprehensive income (¥ million) | 107,101 | 365,385 | -70.7% |
| EPS (¥) | 192.53 | 71.57 | +169.0% |
| Core EPS (¥) | 308 | 279 | +10.4% |
| Total assets (¥ million) | 15,271,498 | 15,511,506 | -1.5% |
| Equity attrib. to owners of parent (¥ million) | 7,416,185 | 7,429,441 | -0.2% |
| Equity ratio | 48.6% | 47.9% | +0.7 pt |
| FY3/2027 guidance — revenue (¥ million) | 4,700,000 | — | +4.3% |
| FY3/2027 guidance — core operating profit (¥ million) | 1,190,000 | — | +1.5% |
| FY3/2027 guidance — operating profit (¥ million) | 453,000 | — | — |
| FY3/2027 guidance — net profit (¥ million) | 209,000 | — | — |
| Annual dividend per share (¥) | 204.00 | 200.00 | +2.0% |
JapanStockPulse provides informational content only and does not constitute investment advice. Figures are taken from the company's published earnings short report and may be subject to subsequent revision.