Parks drive the gain
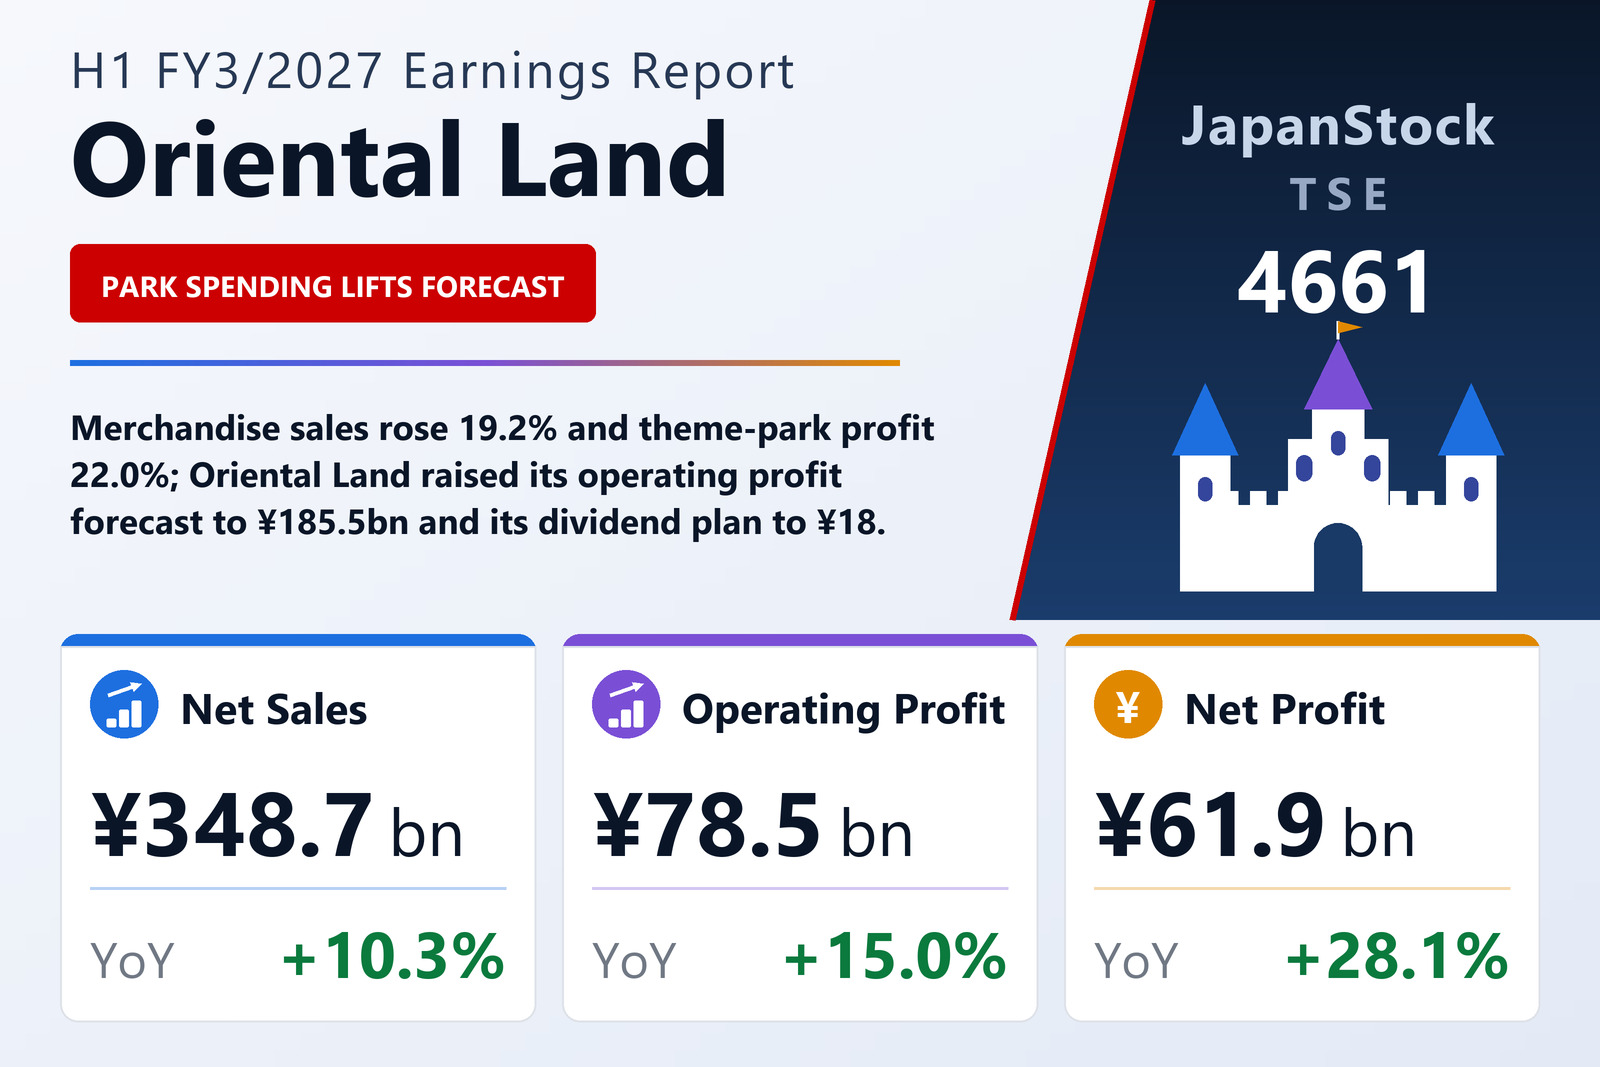
Oriental Land Co., Ltd. (TSE: 4661) reported consolidated results for the first half of FY3/2027, April 1 to September 30, 2026, on October 29, 2026 under Japanese GAAP. Theme Park revenue rose 11.7% to ¥289,012 million and segment profit 22.0% to ¥60,755 million. Within the parks, merchandise sales grew 19.2% to ¥88,230 million, food and beverage 13.1% to ¥49,575 million and attraction and show income 6.5% to ¥136,062 million. The Hotel segment grew revenue 5.3% to ¥59,470 million, but its profit slipped 2.6% to ¥17,058 million. Ordinary profit rose faster than operating profit because of ¥10,194 million in insurance proceeds booked as non-operating income. Oriental Land Cruise was newly consolidated in the period. Earnings per share were ¥37.73 against ¥29.47.
Forecast and dividend raised
Oriental Land raised its FY3/2027 forecast: net sales to ¥763,334 million (+8.3%) from ¥724,312 million, operating profit to ¥185,465 million (+10.1%), ordinary profit to ¥195,784 million (+15.4%) from ¥168,057 million and net profit to ¥133,526 million (+9.6%) from ¥113,797 million, for earnings per share of ¥81.42. It paid an interim dividend of ¥9, up from ¥7, and now plans ¥9 at year end, an annual ¥18 against ¥15. Construction in progress rose to ¥143,940 million from ¥103,200 million; total assets were ¥1,636,845 million and the equity ratio rose to 70.2% from 67.5%.
| Metric | H1 FY3/2027 | H1 FY3/2026 | Change |
|---|---|---|---|
| Net sales (¥ million) | 348,742 | 316,189 | +10.3% |
| Operating profit (¥ million) | 78,497 | 68,241 | +15.0% |
| Ordinary profit (¥ million) | 90,041 | 69,305 | +29.9% |
| Net profit attrib. to owners of parent (¥ million) | 61,881 | 48,310 | +28.1% |
| Comprehensive income (¥ million) | 60,811 | 60,701 | +0.2% |
| EPS (¥) | 37.73 | 29.47 | +28.0% |
| Theme Park — revenue (¥ million) | 289,012 | 258,770 | +11.7% |
| Theme Park — segment profit (¥ million) | 60,755 | 49,780 | +22.0% |
| Hotel — revenue (¥ million) | 59,470 | 56,456 | +5.3% |
| Hotel — segment profit (¥ million) | 17,058 | 17,505 | -2.6% |
| Total assets (¥ million) | 1,636,845 | 1,629,076 | +0.5% |
| Net assets (¥ million) | 1,148,925 | 1,100,021 | +4.4% |
| Equity ratio | 70.2% | 67.5% | +2.7 pt |
| FY3/2027 guidance — revenue (¥ million) | 763,334 | — | +8.3% |
| FY3/2027 guidance — operating profit (¥ million) | 185,465 | — | +10.1% |
| FY3/2027 guidance — ordinary profit (¥ million) | 195,784 | — | +15.4% |
| FY3/2027 guidance — net profit (¥ million) | 133,526 | — | +9.6% |
| Annual dividend per share (¥) | 18.00 | 15.00 | +20.0% |
JapanStockPulse provides informational content only and does not constitute investment advice. Figures are taken from the company's published earnings short report and may be subject to subsequent revision.