Factory automation leads a broad-based surge
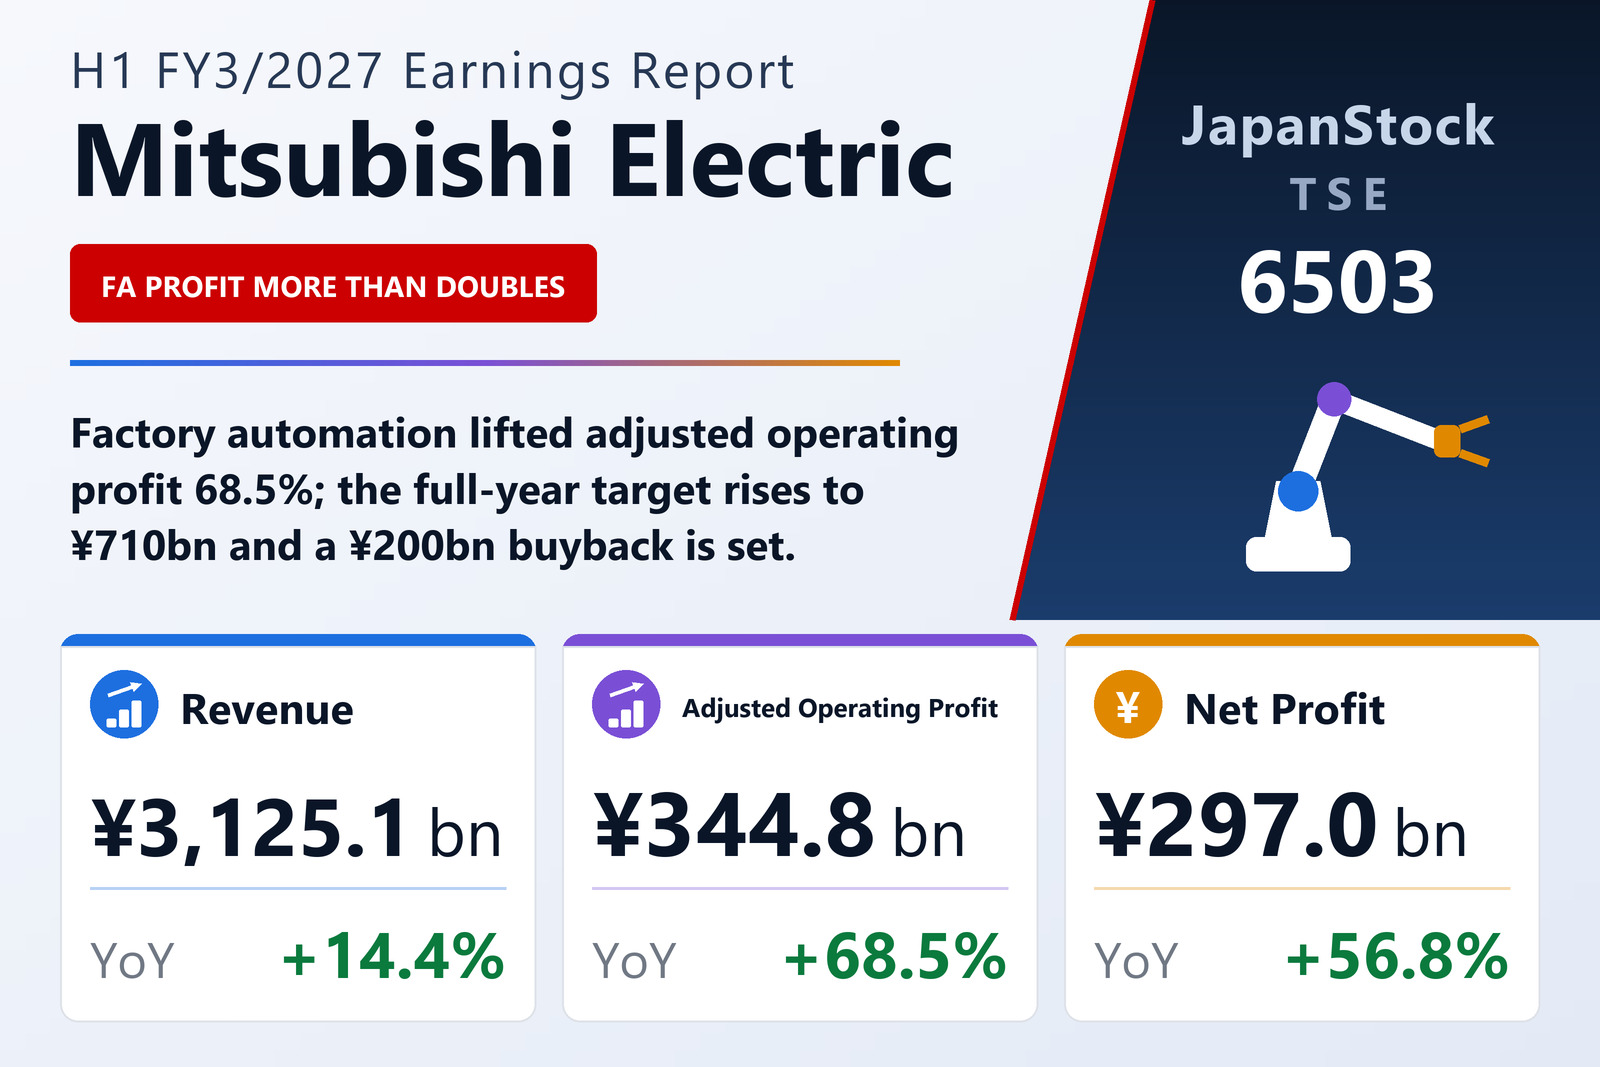
Mitsubishi Electric Corporation (TSE: 6503) reported consolidated results for the first half of FY3/2027, covering April 1 to September 30, 2026, on October 30, 2026 under IFRS. Revenue rose 14.4% to ¥3,125,147 million, adjusted operating profit rose 68.5% to ¥344,778 million — a margin of 11.03% against 7.49% — and operating profit rose 59.6% to ¥358,112 million. Pre-tax profit increased 58.9% to ¥403,553 million, helped by equity-method income of ¥48,828 million against ¥18,719 million, and net profit attributable to shareholders rose 56.8% to ¥297,025 million, for EPS of ¥145.12 against ¥91.74. The second quarter was stronger than the first, with revenue up 15% and adjusted operating profit up 83% to ¥202.6 billion. Part of the gain is accounting: the switch from declining-balance to straight-line depreciation adopted this year raised operating profit by ¥19,650 million in the half, about 14% of the ¥140,222 million increase in adjusted operating profit. A weaker yen — ¥160 to the dollar against ¥146, and ¥185 to the euro against ¥169 — added roughly ¥137 billion to revenue.
Industry & Mobility revenue rose 14.8% to ¥908,268 million and adjusted operating profit 129.7% to ¥123,621 million. Within it, FA systems lifted revenue 28% to ¥482.3 billion and adjusted operating profit about 2.5 times to ¥82.2 billion, while automotive equipment roughly doubled its profit to ¥41.3 billion on revenue up 3%. Life grew revenue 12.5% to ¥1,281,393 million and profit 52.5% to ¥141,433 million, led by air-conditioning and home appliances, whose profit rose 64% to ¥108.9 billion. Infrastructure revenue rose 16.6% to ¥672,726 million and profit 50.0% to ¥60,564 million: defence and space profit more than doubled to ¥20.2 billion and energy systems rose 83%, while social systems fell 21% to ¥14.2 billion. Semiconductor & Device profit rose 37.3% to ¥32,965 million, and Digital Innovation swung to an adjusted operating loss of ¥358 million from a ¥3,650 million profit. Orders point the same way, with FA systems up 48% and Semiconductor & Device up 68%. Reported operating profit also includes ¥23,459 million of gains on sales of businesses and assets and a ¥10,426 million special retirement expense.
Operating forecast raised; two portfolio deals and a buyback
Mitsubishi Electric raised its FY3/2027 revenue forecast to ¥6,550,000 million from ¥6,270,000 million (+11.1% year on year), adjusted operating profit to ¥710,000 million from ¥620,000 million (+41.6%) and pre-tax profit to ¥695,000 million from ¥670,000 million, but lowered net profit attributable to shareholders to ¥465,000 million from ¥495,000 million (+14.0%), with EPS of ¥227.20 against ¥241.87 previously. The plan assumes ¥155 to the dollar and ¥175 to the euro for the second half. The dividend forecast is unchanged at ¥60.00 for the year against ¥55.00, made up of an interim ¥30.00 (¥25.00 a year earlier) and a year-end ¥30.00. The equity ratio attributable to owners rose to 63.6% from 60.8% at the end of March.
The filing details two transactions in Industry & Mobility. On October 16, 2026 the company agreed to transfer its automotive equipment business to Mitsubishi Electric Mobility and sell 50% of that company to Lin Yin International Investment, the investment arm of Hon Hai Precision Industry, for a planned ¥115 billion, to offer EV platforms; it expects to book an impairment loss of about ¥100 billion in FY3/2027. On October 20, 2026 it agreed to move its distribution and control equipment business — low-voltage circuit breakers, magnetic contactors, measuring instruments and small UPS units — into a new company and sell 51% to ABB's Japanese unit for a planned ¥82.4 billion, expecting a gain of about ¥90 billion in FY3/2028. Both deals are scheduled to close in October 2027. The board also approved a buyback of up to 80 million shares or ¥200,000 million between November 1, 2026 and March 31, 2027, and the company will cancel 23 million treasury shares, 1.09% of shares issued, on November 30, 2026.
| Metric | H1 FY3/2027 | H1 FY3/2026 | Change |
|---|---|---|---|
| Revenue (¥ million) | 3,125,147 | 2,732,504 | +14.4% |
| Adjusted operating profit (¥ million) | 344,778 | 204,556 | +68.5% |
| Adjusted operating margin | 11.03% | 7.49% | +3.54 pt |
| — gain on sale of businesses and assets (¥ million) | 23,459 | 15,888 | +47.7% |
| — special retirement expense (¥ million) | −10,426 | — | — |
| Operating profit (¥ million) | 358,112 | 224,366 | +59.6% |
| Operating margin | 11.46% | 8.21% | +3.25 pt |
| Pre-tax profit (¥ million) | 403,553 | 253,975 | +58.9% |
| Net profit attrib. to owners of parent (¥ million) | 297,025 | 189,397 | +56.8% |
| Comprehensive income (¥ million) | 289,136 | 256,985 | +12.5% |
| EPS (¥) | 145.12 | 91.74 | +58.2% |
| Infrastructure — revenue (¥ million) | 672,726 | 576,933 | +16.6% |
| Infrastructure — adjusted operating profit (¥ million) | 60,564 | 40,384 | +50.0% |
| Industry & Mobility — revenue (¥ million) | 908,268 | 791,190 | +14.8% |
| Industry & Mobility — adjusted operating profit (¥ million) | 123,621 | 53,812 | +129.7% |
| Life — revenue (¥ million) | 1,281,393 | 1,139,117 | +12.5% |
| Life — adjusted operating profit (¥ million) | 141,433 | 92,762 | +52.5% |
| Digital Innovation — revenue (¥ million) | 48,280 | 38,449 | +25.6% |
| Digital Innovation — adjusted operating profit (¥ million) | −358 | 3,650 | profit to loss |
| Semiconductor & Device — revenue (¥ million) | 147,338 | 127,322 | +15.7% |
| Semiconductor & Device — adjusted operating profit (¥ million) | 32,965 | 24,002 | +37.3% |
| Other — revenue (¥ million) | 67,142 | 59,493 | +12.9% |
| Other — adjusted operating profit (¥ million) | 18,273 | 13,014 | +40.4% |
| Corporate expense and eliminations, adjusted OP (¥ million) | −31,720 | −23,068 | loss widened |
| Revenue — Japan (¥ million) | 1,418,228 | 1,285,251 | +10.3% |
| Revenue — overseas (¥ million) | 1,706,919 | 1,447,253 | +17.9% |
| — of which Asia (¥ million) | 742,652 | 589,585 | +26.0% |
| — of which Europe (¥ million) | 455,992 | 381,696 | +19.5% |
| — of which North America (¥ million) | 447,919 | 425,875 | +5.2% |
| Total assets (¥ million) | 7,385,602 | 7,369,571 | +0.2% |
| Total equity (¥ million) | 4,832,360 | 4,629,993 | +4.4% |
| Equity attrib. to owners of parent (¥ million) | 4,695,982 | 4,484,266 | +4.7% |
| Equity ratio | 63.6% | 60.8% | +2.8 pt |
| FY3/2027 guidance — revenue (¥ million) | 6,550,000 | — | +11.1% |
| FY3/2027 guidance — adjusted operating profit (¥ million) | 710,000 | — | +41.6% |
| FY3/2027 guidance — pre-tax profit (¥ million) | 695,000 | — | +32.1% |
| FY3/2027 guidance — net profit (¥ million) | 465,000 | — | +14.0% |
| FY3/2027 guidance — EPS (¥) | 227.20 | — | — |
| Annual dividend per share (¥) | 60.00 | 55.00 | +9.1% |
JapanStockPulse provides informational content only and does not constitute investment advice. Figures are taken from the company's published earnings short report and may be subject to subsequent revision.