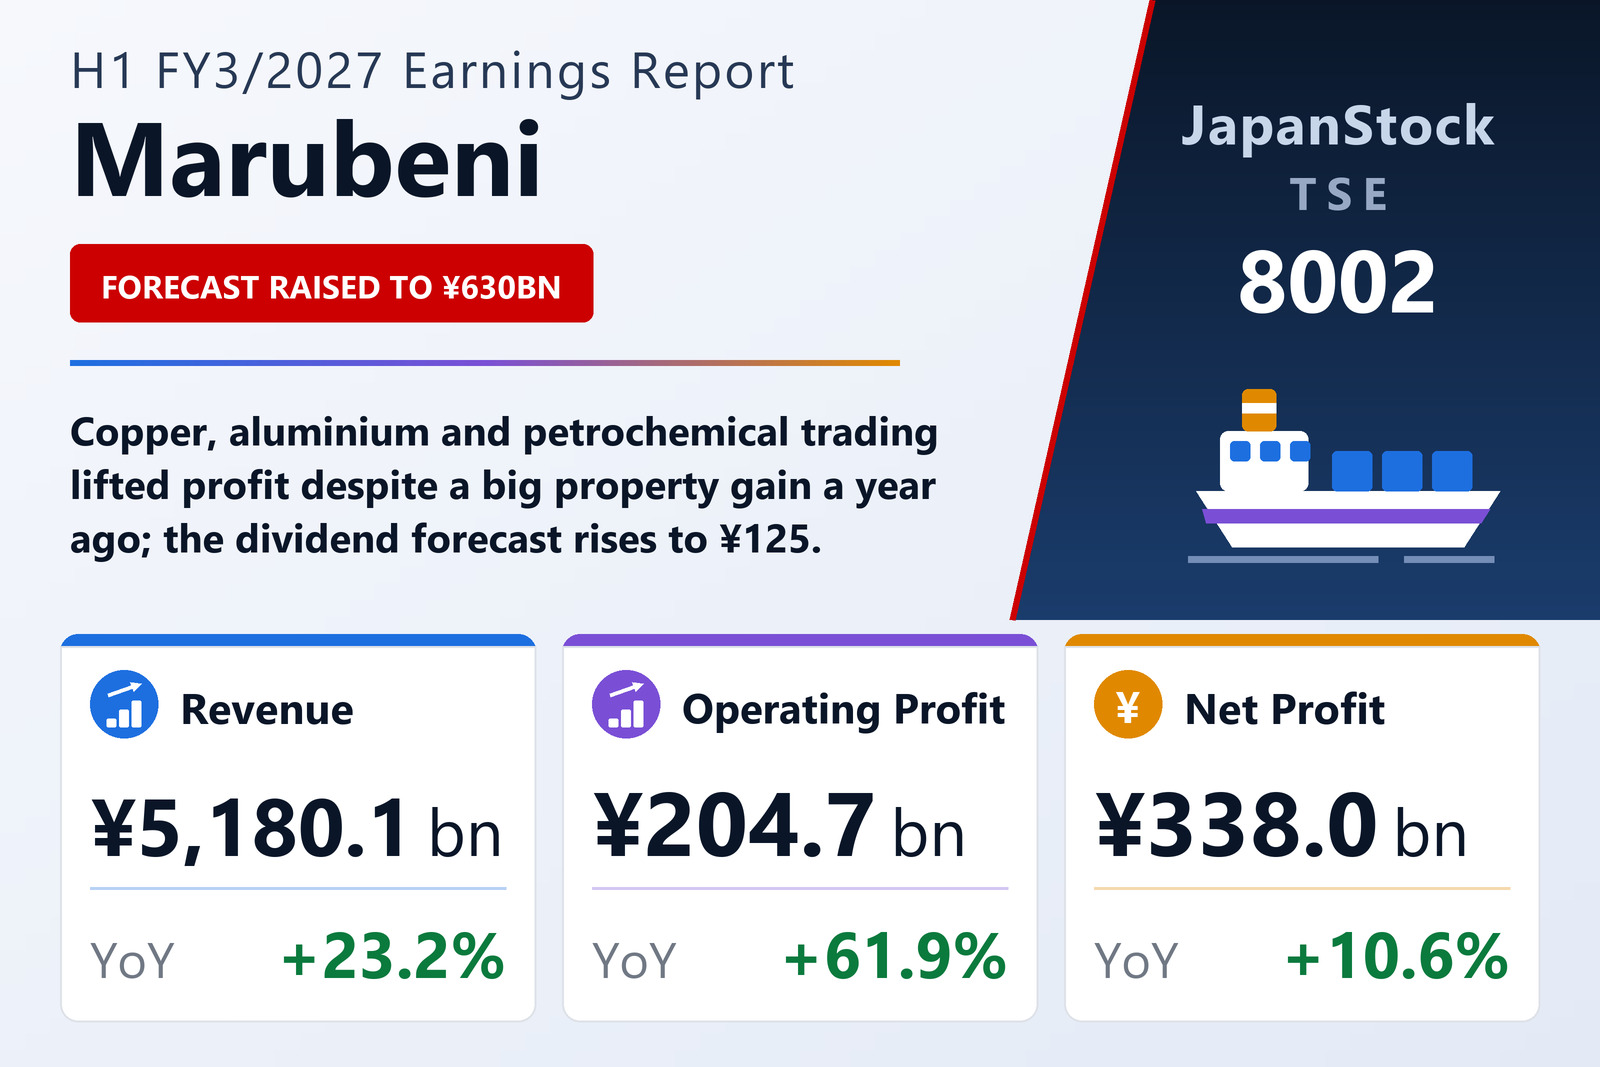
Metals and energy offset a property gain
Marubeni Corporation (TSE: 8002) reported consolidated results for the first half of FY3/2027, April 1 to September 30, 2026, on November 4, 2026 under IFRS. Gross profit rose 26.3% to about ¥704 billion, with Energy & Chemicals up ¥47.8 billion on petrochemical trading and oil and gas, Next Generation Business Development up ¥22.5 billion on pharmaceutical sales, Metals & Mineral Resources up ¥17.7 billion on aluminium and Australian coking coal, and Power & Infrastructure Services up ¥14.9 billion on power wholesale and retail. Equity-method earnings grew 24.4% to about ¥199 billion, led by Chilean copper and Australian coking coal and by aircraft leasing.
By segment, attributable profit in Metals & Mineral Resources rose to about ¥89.4 billion from ¥52.2 billion and Energy & Chemicals to about ¥41.8 billion from ¥3.9 billion, which had included a write-down of oil and gas assets. Power & Infrastructure Services rose to about ¥58.2 billion on gains from selling overseas IPP stakes, and Aerospace & Mobility to about ¥35.7 billion. Finance, Leasing & Real Estate fell to about ¥42.7 billion from ¥125.7 billion, against a prior-year after-tax valuation gain of ¥76.5 billion from combining its domestic real-estate business with Dai-ichi Life Holdings, now Daiichi Life Group.
Forecast raised by ¥50 billion
Attributable profit reached 58% of the original ¥580,000 million target, and Marubeni raised its FY3/2027 forecast to ¥630,000 million (+15.8%), mainly on higher petrochemical trading profits and a stronger Chilean copper business; forecast earnings per share rose to ¥388.16 from ¥356.75. The company paid an interim dividend of ¥62.50, against ¥50 a year earlier, and now plans ¥125 for the year against ¥107.50 for FY3/2026. Treasury stock rose to 38,995,594 shares from 22,361,446 in March. The ratio of equity attributable to owners of the parent was 41.7%.
| Metric | H1 FY3/2027 | H1 FY3/2026 | Change |
|---|---|---|---|
| Revenue (¥ million) | 5,180,128 | 4,203,366 | +23.2% |
| Operating profit (¥ million) | 204,726 | 126,419 | +61.9% |
| Pre-tax profit (¥ million) | 417,773 | 365,543 | +14.3% |
| Net profit attrib. to owners of parent (¥ million) | 338,027 | 305,497 | +10.6% |
| Comprehensive income (¥ million) | 244,197 | 363,751 | -32.9% |
| EPS (¥) | 207.58 | 185.18 | +12.1% |
| Total assets (¥ million) | 10,563,847 | 10,531,764 | +0.3% |
| Equity attrib. to owners of parent (¥ million) | 4,403,516 | 4,363,719 | +0.9% |
| Equity ratio | 41.7% | 41.4% | +0.3 pt |
| FY3/2027 guidance — net profit (¥ million) | 630,000 | — | +15.8% |
| Annual dividend per share (¥) | 125.00 | 107.50 | +16.3% |
JapanStockPulse provides informational content only and does not constitute investment advice. Figures are taken from the company's published earnings short report and may be subject to subsequent revision.