Currency gains outweigh higher costs
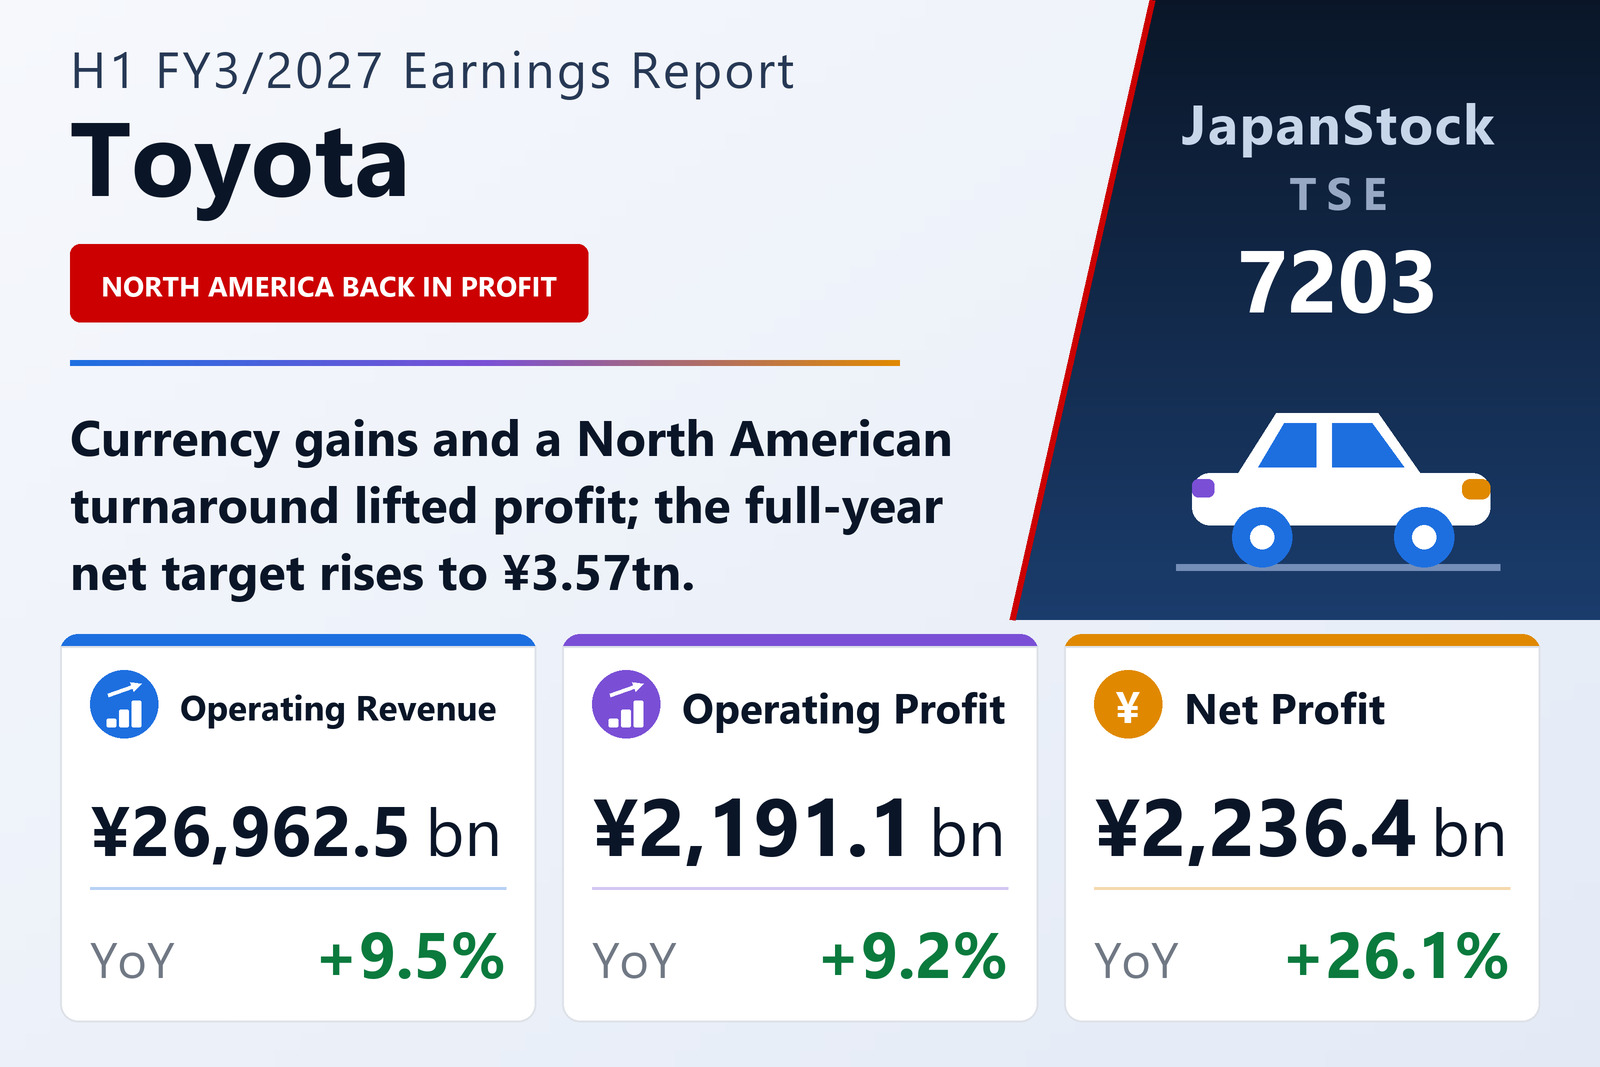
Toyota Motor Corporation (TSE: 7203) reported consolidated results under IFRS for the first half of FY3/2027, April 1 to September 30, 2026, on November 5, 2026. Consolidated vehicle sales slipped 0.5% to 4,758 thousand units: sales in Japan rose 5.6% to 1,024 thousand, while overseas sales fell 2.1% to 3,734 thousand. The company attributed the ¥185.4 billion rise in operating profit to ¥685.0 billion of currency effects and ¥165.0 billion from marketing efforts, against ¥340.0 billion of higher costs after cost-reduction efforts, ¥20.0 billion of higher expenses and ¥304.6 billion of other items. Pre-tax profit rose 19.2% to ¥2,954,403 million.
Automotive operating profit rose 7.6% to ¥1,598,203 million on revenue up 8.5%, and Financial Services earned ¥472,381 million, up 4.9%, on a larger lending balance. By region, Japan's operating profit rose 12.2% to ¥1,253,383 million and Europe's 9.2% to ¥219,204 million, while North America swung to a profit of ¥166,188 million from a loss of ¥67,865 million, helped by lower expenses. Asia slipped 1.6% to ¥437,171 million. Hino Motors left the consolidated group on its business integration with Mitsubishi Fuso Truck and Bus, and Toyota booked a ¥95,445 million loss on the loss of control; the sale of its Toyota Industries shares was also completed.
Forecast raised, 1.2 billion shares to be cancelled
Toyota now expects FY3/2027 operating revenue of ¥53,500,000 million (+5.6%), operating profit of ¥3,900,000 million (+3.6%) and net profit attributable to owners of ¥3,570,000 million (-7.2%), up from the ¥3.4 trillion net profit target it set in August. It paid an interim dividend of ¥50, against ¥45 a year earlier, and kept its annual dividend forecast at ¥100. The board also resolved to cancel 1,200,000,000 treasury shares. Total assets fell 3.4% to ¥101,980,759 million, and operating cash flow came to ¥1,603.9 billion, down from ¥2,944.6 billion.
| Metric | H1 FY3/2027 | H1 FY3/2026 | Change |
|---|---|---|---|
| Operating revenue (¥ million) | 26,962,462 | 24,630,753 | +9.5% |
| Operating profit (¥ million) | 2,191,124 | 2,005,692 | +9.2% |
| Pre-tax profit (¥ million) | 2,954,403 | 2,478,127 | +19.2% |
| Net profit attrib. to owners of parent (¥ million) | 2,236,446 | 1,773,426 | +26.1% |
| Comprehensive income (¥ million) | 2,173,301 | 2,348,135 | -7.4% |
| EPS (¥) | 185.97 | 136.07 | +36.7% |
| Automotive — revenue (¥ million) | 23,981,130 | 22,100,559 | +8.5% |
| Automotive — segment profit (¥ million) | 1,598,203 | 1,485,476 | +7.6% |
| Financial Services — revenue (¥ million) | 2,762,072 | 2,330,333 | +18.5% |
| Financial Services — segment profit (¥ million) | 472,381 | 450,459 | +4.9% |
| Operating profit — North America (¥ million) | 166,188 | -67,865 | loss to profit |
| Total assets (¥ million) | 101,980,759 | 105,522,331 | -3.4% |
| Equity attrib. to owners of parent (¥ million) | 37,447,031 | 39,918,854 | -6.2% |
| Equity ratio | 36.7% | 37.8% | -1.1 pt |
| FY3/2027 guidance — operating revenue (¥ million) | 53,500,000 | — | +5.6% |
| FY3/2027 guidance — operating profit (¥ million) | 3,900,000 | — | +3.6% |
| FY3/2027 guidance — net profit (¥ million) | 3,570,000 | — | -7.2% |
| Annual dividend per share (¥) | 100.00 | 95.00 | +5.3% |
JapanStockPulse provides informational content only and does not constitute investment advice. Figures are taken from the company's published earnings short report and may be subject to subsequent revision.