Switch 2 software carries the half
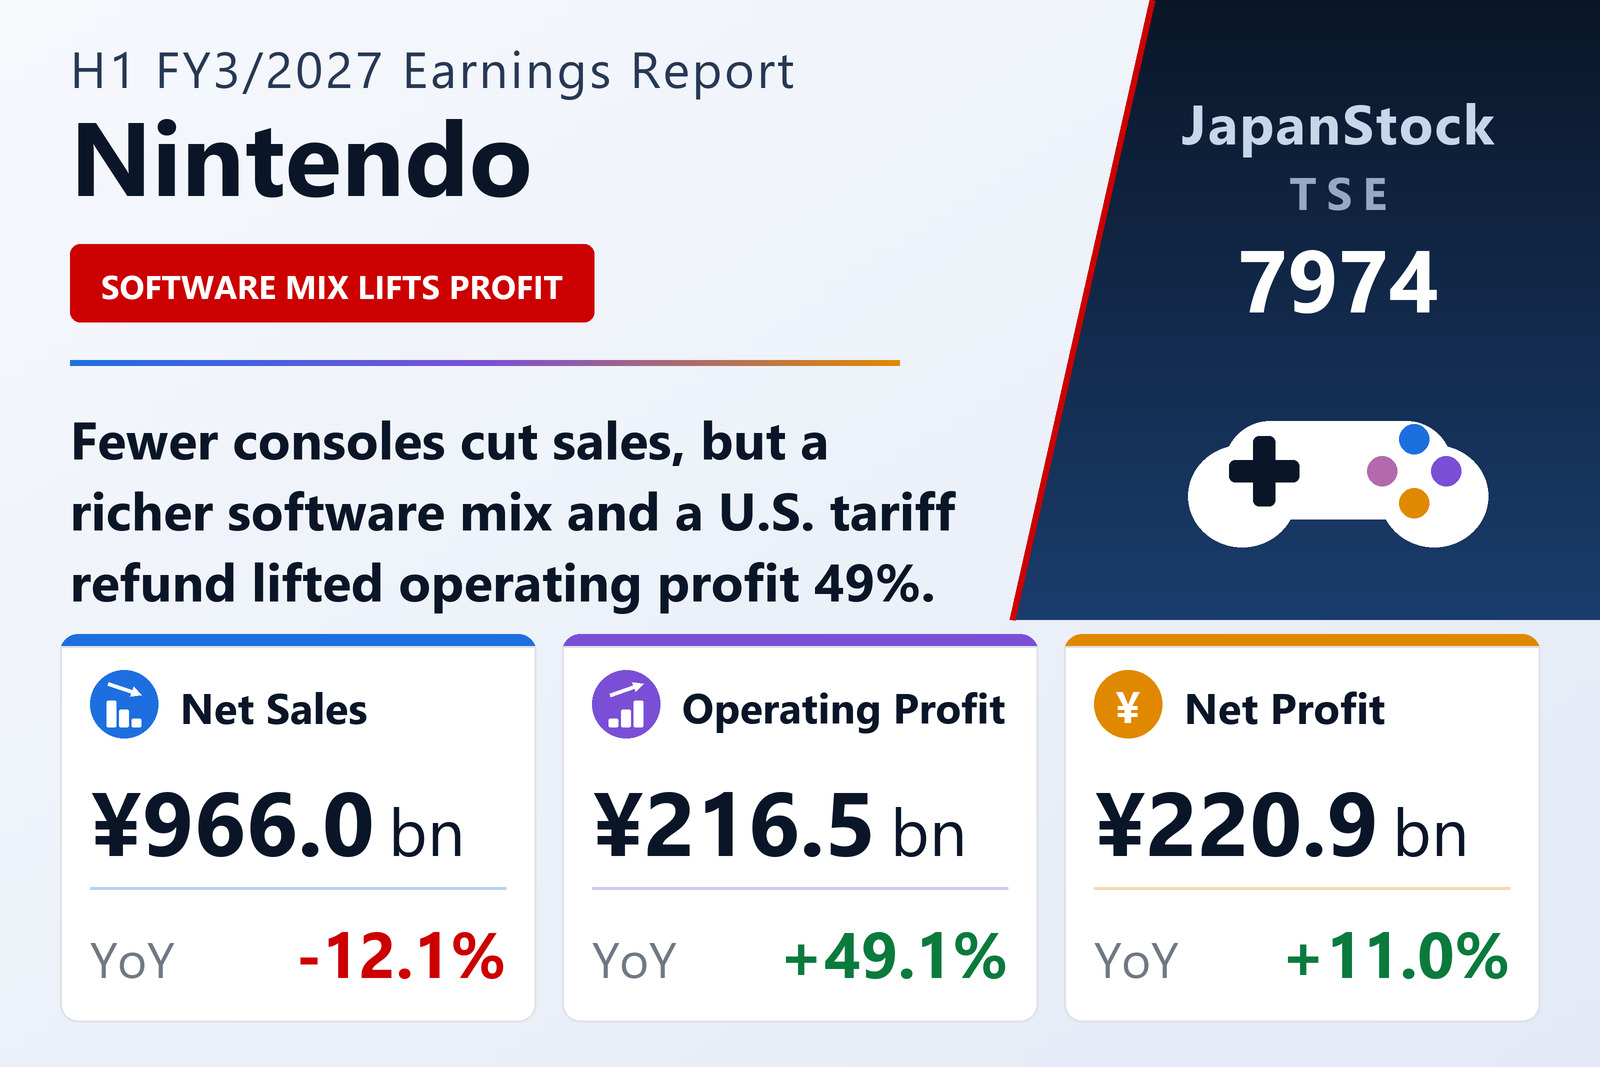
Nintendo Co., Ltd. (TSE: 7974) reported consolidated results for the first half of FY3/2027, April 1 to September 30, 2026, on November 5, 2026. Nintendo Switch 2 hardware sold 6.49 million units and Switch 2 software 24.49 million units, led by Splatoon Raiders (2.42 million), Fire Emblem: Fortune's Weave (1.34 million) and Star Fox (1.17 million), with continued sales of Mario Kart World and Pokémon Pokopia. The original Nintendo Switch sold 1.27 million consoles and 65.73 million software units, including 8.81 million of Tomodachi Life: Living the Dream and 2.89 million of Rhythm Heaven Groove.
Digital sales rose 60.5% to ¥249.6 billion, helped by downloads of titles also sold as packages, and IP-related income rose 87.9% to ¥62.7 billion on the strength of The Super Mario Galaxy Movie. Overseas sales were ¥762.4 billion, or 78.9% of the total. Nintendo said operating profit benefited from the higher software share and from a refund, received in the first quarter, of U.S. tariffs imposed under IEEPA that it had booked as cost of sales. Equity-method income of ¥60.8 billion and interest income of ¥26.7 billion lifted ordinary profit 27.4% to ¥300,676 million.
Guidance held, interim dividend raised
Nintendo kept its FY3/2027 forecast of net sales of ¥2,050,000 million (-11.4%), operating profit of ¥370,000 million (+2.7%) and net profit attributable to owners of ¥310,000 million (-26.9%). It declared an interim dividend of ¥76, against ¥42 a year earlier, and revised its annual dividend forecast to ¥162, with ¥86 planned at year-end. A Zelda 40th anniversary edition of Switch 2 went on sale in October, and Metroid is slated for January. Total assets rose 3.4% to ¥3,936,480 million, and the equity ratio was 75.8%.
| Metric | H1 FY3/2027 | H1 FY3/2026 | Change |
|---|---|---|---|
| Net sales (¥ million) | 966,041 | 1,099,565 | -12.1% |
| Operating profit (¥ million) | 216,500 | 145,181 | +49.1% |
| Ordinary profit (¥ million) | 300,676 | 236,040 | +27.4% |
| Net profit attrib. to owners of parent (¥ million) | 220,917 | 198,936 | +11.0% |
| Comprehensive income (¥ million) | 231,727 | 191,758 | +20.8% |
| EPS (¥) | 191.63 | 170.87 | +12.1% |
| Nintendo Switch 2 hardware (million units) | 6.49 | — | — |
| Nintendo Switch 2 software (million units) | 24.49 | — | — |
| Nintendo Switch hardware (million units) | 1.27 | — | — |
| Nintendo Switch software (million units) | 65.73 | — | — |
| Total assets (¥ million) | 3,936,480 | 3,805,312 | +3.4% |
| Net assets (¥ million) | 2,983,541 | 2,955,180 | +1.0% |
| Equity ratio | 75.8% | 77.6% | -1.8 pt |
| FY3/2027 guidance — revenue (¥ million) | 2,050,000 | — | -11.4% |
| FY3/2027 guidance — operating profit (¥ million) | 370,000 | — | +2.7% |
| FY3/2027 guidance — ordinary profit (¥ million) | 430,000 | — | -20.7% |
| FY3/2027 guidance — net profit (¥ million) | 310,000 | — | -26.9% |
| Annual dividend per share (¥) | 162.00 | 219.00 | -26.0% |
JapanStockPulse provides informational content only and does not constitute investment advice. Figures are taken from the company's published earnings short report and may be subject to subsequent revision.