Facilities and single-family homes lead
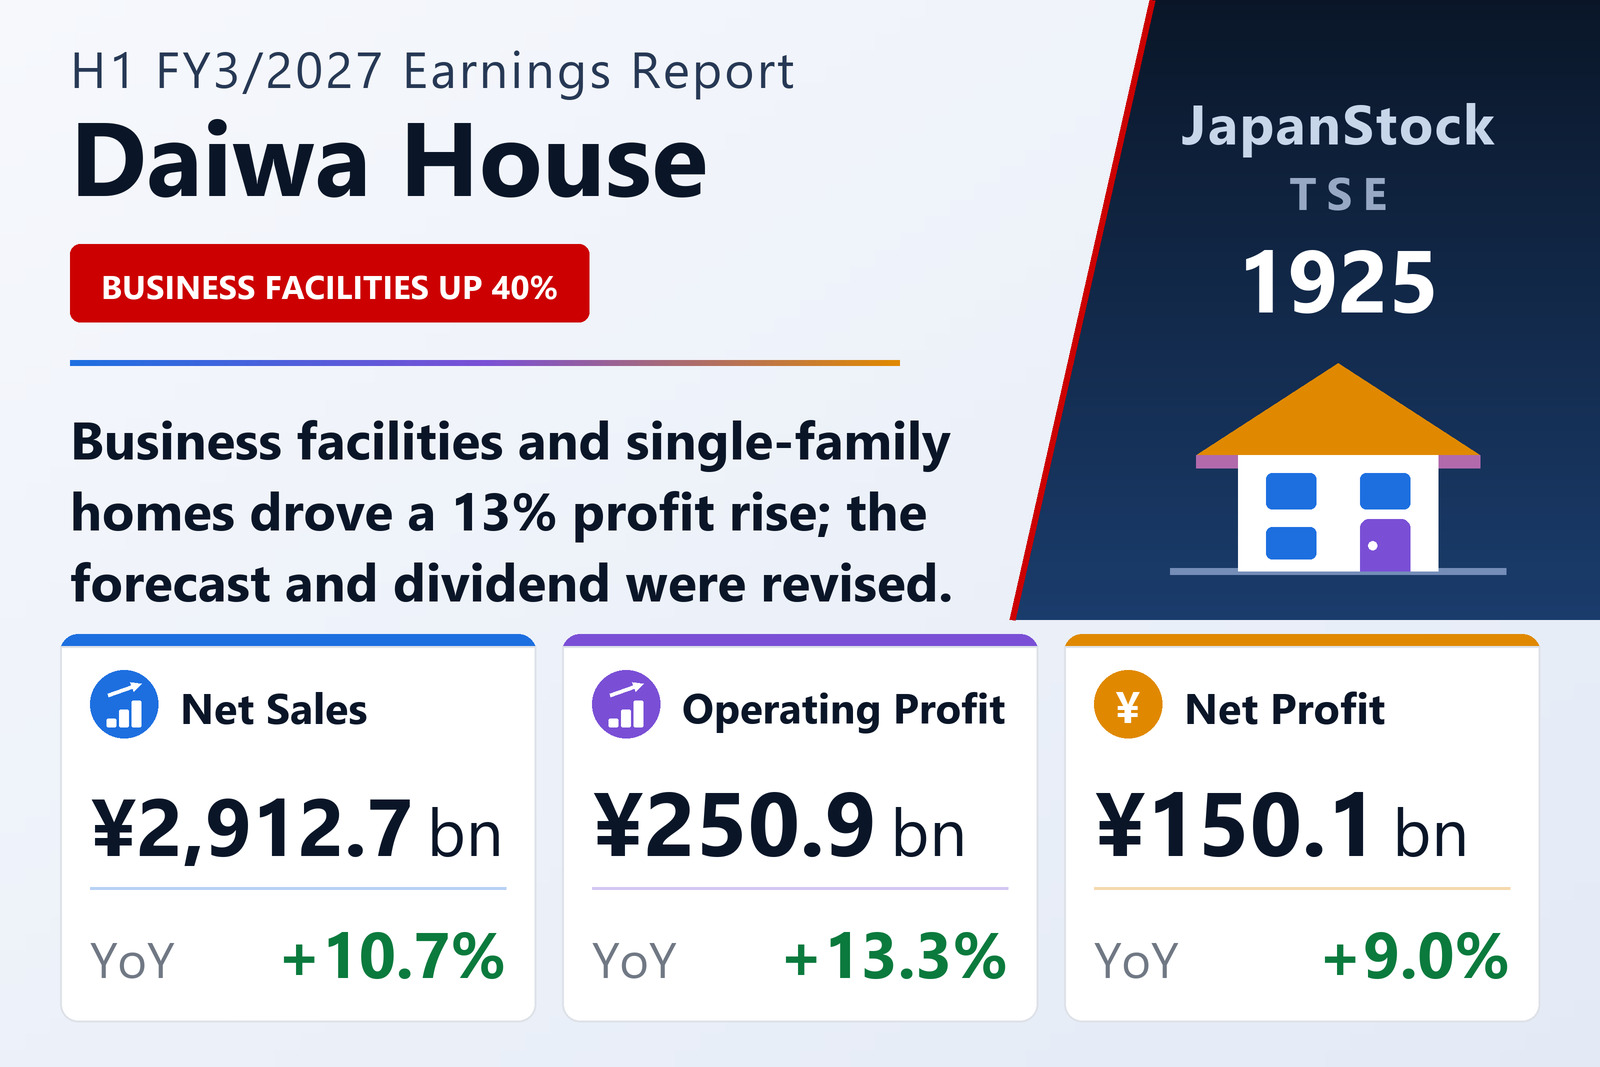
Daiwa House Industry Co., Ltd. (TSE: 1925) reported consolidated results for the first half of FY3/2027, April 1 to September 30, 2026, on November 11, 2026, and from this period discloses non-GAAP operating profit and non-GAAP net profit. Business Facilities sales rose 17.8% to ¥697,002 million and non-GAAP operating profit 39.9% to ¥88,874 million. Single-Family Houses sales rose 18.0% to ¥638,383 million and profit 16.9% to ¥30,789 million: in Japan, Smart Made Housing and Ready Made Housing sold well alongside high-end urban homes, and in the U.S. orders rose 21% and deliveries 28% in January–June, though high sales incentives weighed on margins; in May Stanley Martin acquired United Homes Group, a homebuilder in the Carolinas and Georgia.
Rental Housing sales rose 4.7% to ¥735,917 million and profit 4.3% to ¥79,101 million, Condominiums profit rose 75.2% to ¥14,309 million and Environment & Energy 12.3% to ¥8,840 million, while Commercial Facilities profit fell 5.9% to ¥82,146 million despite sales up 5.2%. Ordinary profit rose 10.8% to ¥227,427 million. Earnings per share are adjusted for the 2-for-1 stock split of October 1, 2026. Total assets rose 8.1% to ¥9,090,293 million, and the equity ratio was 32.8%.
Forecast and dividend revised
Daiwa House revised its FY3/2027 forecast to net sales of ¥6,150,000 million (+10.3%), operating profit of ¥500,000 million (-18.7%), non-GAAP operating profit of ¥525,000 million (+2.1%) and net profit attributable to owners of ¥287,000 million (-18.1%). It paid an interim dividend of ¥86, up from ¥75, and plans a split-adjusted ¥47 at year-end, equal to ¥94 before the split and ¥180 for the year against ¥175, which had included a ¥10 70th-anniversary payment.
| Metric | H1 FY3/2027 | H1 FY3/2026 | Change |
|---|---|---|---|
| Net sales (¥ million) | 2,912,657 | 2,630,945 | +10.7% |
| Operating profit (¥ million) | 250,945 | 221,399 | +13.3% |
| Non-GAAP operating profit (¥ million) | 263,960 | 229,297 | +15.1% |
| Ordinary profit (¥ million) | 227,427 | 205,341 | +10.8% |
| Net profit attrib. to owners of parent (¥ million) | 150,122 | 137,718 | +9.0% |
| Comprehensive income (¥ million) | 187,788 | 89,769 | +109.2% |
| EPS (¥) | 121.18 | 111.31 | +8.9% |
| Non-GAAP operating profit — Business Facilities (¥ million) | 88,874 | — | +39.9% |
| Non-GAAP operating profit — Commercial Facilities (¥ million) | 82,146 | — | -5.9% |
| Non-GAAP operating profit — Rental Housing (¥ million) | 79,101 | — | +4.3% |
| Non-GAAP operating profit — Single-Family Houses (¥ million) | 30,789 | — | +16.9% |
| Total assets (¥ million) | 9,090,293 | 8,412,419 | +8.1% |
| Net assets (¥ million) | 3,080,745 | 3,022,275 | +1.9% |
| Equity ratio | 32.8% | 34.4% | -1.6 pt |
| FY3/2027 guidance — revenue (¥ million) | 6,150,000 | — | +10.3% |
| FY3/2027 guidance — operating profit (¥ million) | 500,000 | — | -18.7% |
| FY3/2027 guidance — Non-GAAP operating profit (¥ million) | 525,000 | — | +2.1% |
| FY3/2027 guidance — net profit (¥ million) | 287,000 | — | -18.1% |
JapanStockPulse provides informational content only and does not constitute investment advice. Figures are taken from the company's published earnings short report and may be subject to subsequent revision.