Reuse demand held up and same-store sales kept climbing
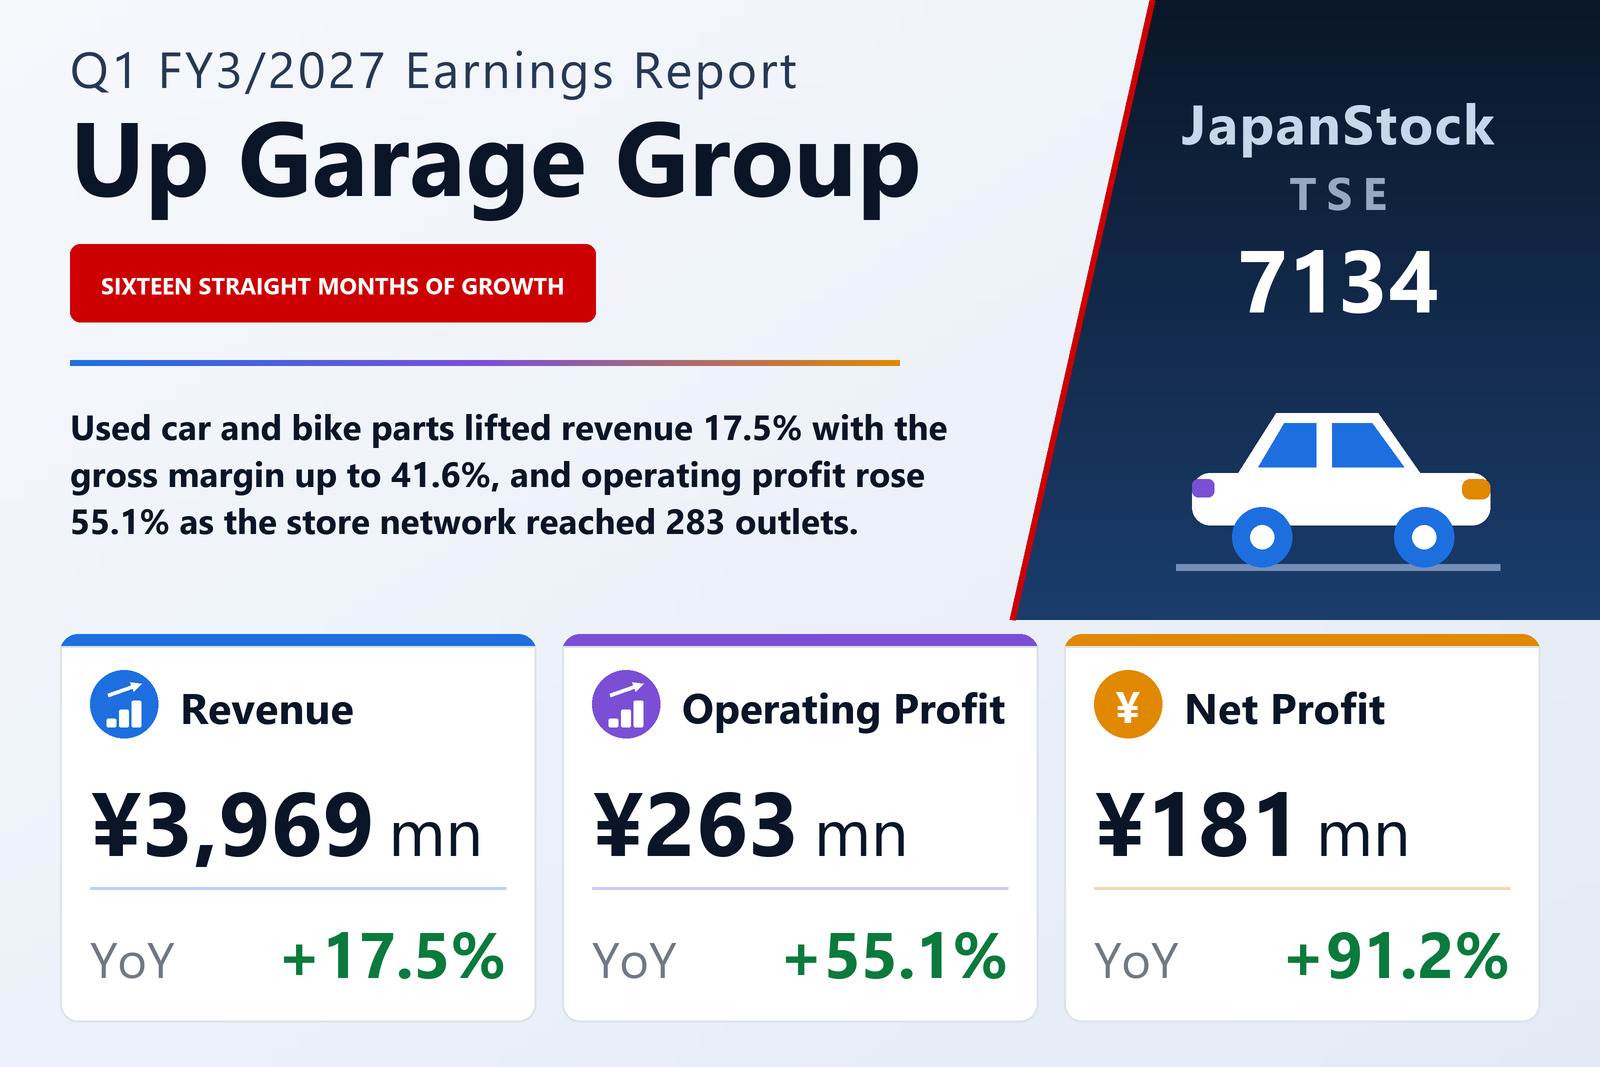
Up Garage Group Co., Ltd. (TSE: 7134), which runs and franchises a chain of stores buying and reselling used car and motorcycle parts and accessories alongside an online marketplace, published consolidated results for the three months to June 30, 2026 on August 3, 2026 under Japanese GAAP. Revenue rose 17.5% to ¥3,969 million, operating profit 55.1% to ¥263 million, ordinary profit 71.7% to ¥274 million and net profit attributable to owners of the parent 91.2% to ¥181 million, for earnings per share of ¥22.88 against ¥11.99. Comprehensive income was ¥178 million, up 79.4%.
The group reports a single segment — buying, selling and related services for car and motorcycle goods — but it does split its revenue by format. The reuse format (directly operated stores, the franchise system and the e-commerce site) produced ¥2,491 million, up 20.4%. The company attributes it to consumer demand for used goods and the reuse market staying strong while prices generally, and new car and bike accessories in particular, kept rising. At directly operated stores, sales at existing stores ran at 108.5% of the prior-year quarter and have now beaten the same month a year earlier for 16 consecutive months, with stores opened in the previous year adding on top. Stronger marketing of both buying and selling and a wider fitting-service offer lifted customer visits, and used tyres and wheels led the increase. On the franchise side, royalties, e-commerce commissions and other incidental income all rose on new openings and higher franchise-store sales.
Wholesale grew on member-store count
The wholesale distribution format produced ¥1,478 million, up 13.4%. The company flags the risk that consumers hold back as tyre and other manufacturers keep raising prices, but wholesale into its tyre-wholesale franchise brand was steady as the number of member stores grew, and its ordering platform NexLink ran well on both new customers and higher volumes with existing ones. Other income was ¥0 million, down 87.0%. At June 30, 2026 the network counted 283 stores — 78 directly operated, 203 franchised and 2 overseas — spread over 198 locations: 160 Up Garage, 95 Up Garage Riders, 11 Up Garage Wheels and 17 specialty-brand stores, the last comprising 10 Up Garage Cycles, 2 Up Garage Tools, 1 Up Garage Cars and 4 under a whole-vehicle car and motorcycle buying brand. The tyre-wholesale brand counted 212 member stores.
The margin improved as well as the volume
Gross profit rose 20.2% to ¥1,653 million, faster than revenue, taking the gross margin to 41.6% from 40.7%. Selling, general and administrative expenses rose 15.3% to ¥1,389 million — the company points to the cost of stores opened in the previous year and to personnel costs from the April intake of new graduates — but because revenue grew faster still, the SG&A ratio fell to 35.0% from 35.7%. The operating margin therefore widened to 6.6% from 5.0%. Depreciation, including amortisation of intangible assets, was ¥96 million against ¥86 million.
Below the operating line the gain widens further, and foreign exchange is most of the reason. Net non-operating items swung from a ¥10 million charge to a ¥10 million credit: the prior-year quarter carried a ¥14 million foreign-exchange loss, while this quarter booked a ¥7 million foreign-exchange gain alongside ¥4 million of insurance proceeds. Ordinary profit therefore rose 71.7% against operating profit's 55.1%. Net profit rose further still, 91.2%, because the prior-year quarter also absorbed ¥2 million of extraordinary losses on fixed-asset disposals and carried a heavier tax charge — income taxes took 33.8% of pre-tax profit this quarter against 39.7% a year earlier.
Cash left the balance sheet for tax and the dividend
Total assets fell 3.1% to ¥7,162 million. Current assets fell ¥255 million to ¥4,433 million: inventory rose ¥151 million, but cash and deposits fell ¥345 million on tax payments and the dividend, and trade receivables fell ¥114 million. Fixed assets rose ¥27 million to ¥2,729 million. Liabilities fell 5.2% to ¥2,140 million, mainly ¥89 million less income tax payable and ¥33 million less accrued payables. Net assets fell 2.2% to ¥5,022 million — ¥289 million of dividends paid out against ¥181 million of quarterly profit retained — while the equity ratio improved to 70.1% from 69.4%, because the asset base shrank faster than equity did.
Guidance is unchanged, and the year is back-loaded
The company says the quarter tracked broadly to plan and leaves the forecast it published on May 8, 2026 unchanged. For the first half it guides revenue of ¥7,741 million (+15.5%), operating profit of ¥407 million (+41.5%), ordinary profit of ¥417 million (+48.0%) and net profit of ¥272 million (+62.6%), for earnings per share of ¥34.38. For the full year it guides revenue of ¥17,000 million (+10.5%), operating profit of ¥1,400 million (+26.8%), ordinary profit of ¥1,420 million (+25.7%) and net profit of ¥910 million (+16.5%), for earnings per share of ¥114.80. The first quarter therefore delivered 23.3% of the full-year revenue target but 18.8% of the operating-profit target, and the guidance carries that shape forward: the half-year figure implies ¥144 million of operating profit in the second quarter against ¥263 million in the first, leaving ¥993 million — 71% of the year — for the second half. The filing offers no commentary on the phasing. The annual dividend is guided up to ¥42.50 from ¥36.50, paid entirely at the year end with no interim payment.
| Metric | Q1 FY3/2027 | Q1 FY3/2026 | Change |
|---|---|---|---|
| Revenue (¥ million) | 3,969 | 3,378 | +17.5% |
| Reuse operations — revenue (¥ million) | 2,491 | — | +20.4% |
| Wholesale distribution — revenue (¥ million) | 1,478 | — | +13.4% |
| Gross profit (¥ million) | 1,653 | 1,375 | +20.2% |
| Gross margin | 41.6% | 40.7% | +0.9 pt |
| SG&A expenses (¥ million) | 1,389 | 1,205 | +15.3% |
| Operating profit (¥ million) | 263 | 170 | +55.1% |
| Operating margin | 6.6% | 5.0% | +1.6 pt |
| Ordinary profit (¥ million) | 274 | 159 | +71.7% |
| Net profit attrib. to owners of parent (¥ million) | 181 | 94 | +91.2% |
| Comprehensive income (¥ million) | 178 | 99 | +79.4% |
| EPS (¥) | 22.88 | 11.99 | +90.8% |
| Total assets (¥ million) | 7,162 | 7,390 | −3.1% |
| Net assets (¥ million) | 5,022 | 5,133 | −2.2% |
| Equity ratio | 70.1% | 69.4% | +0.7 pt |
| FY3/2027 guidance — revenue (¥ million) | 17,000 | — | +10.5% |
| FY3/2027 guidance — operating profit (¥ million) | 1,400 | — | +26.8% |
| FY3/2027 guidance — ordinary profit (¥ million) | 1,420 | — | +25.7% |
| FY3/2027 guidance — net profit (¥ million) | 910 | — | +16.5% |
| FY3/2027 guidance — EPS (¥) | 114.80 | — | n.m. |
| Annual dividend per share (¥) | 42.50 | 36.50 | +16.4% |
JapanStockPulse provides informational content only and does not constitute investment advice. Figures are taken from the company's published earnings short report and may be subject to subsequent revision.