A quarter that nearly fills the half-year plan
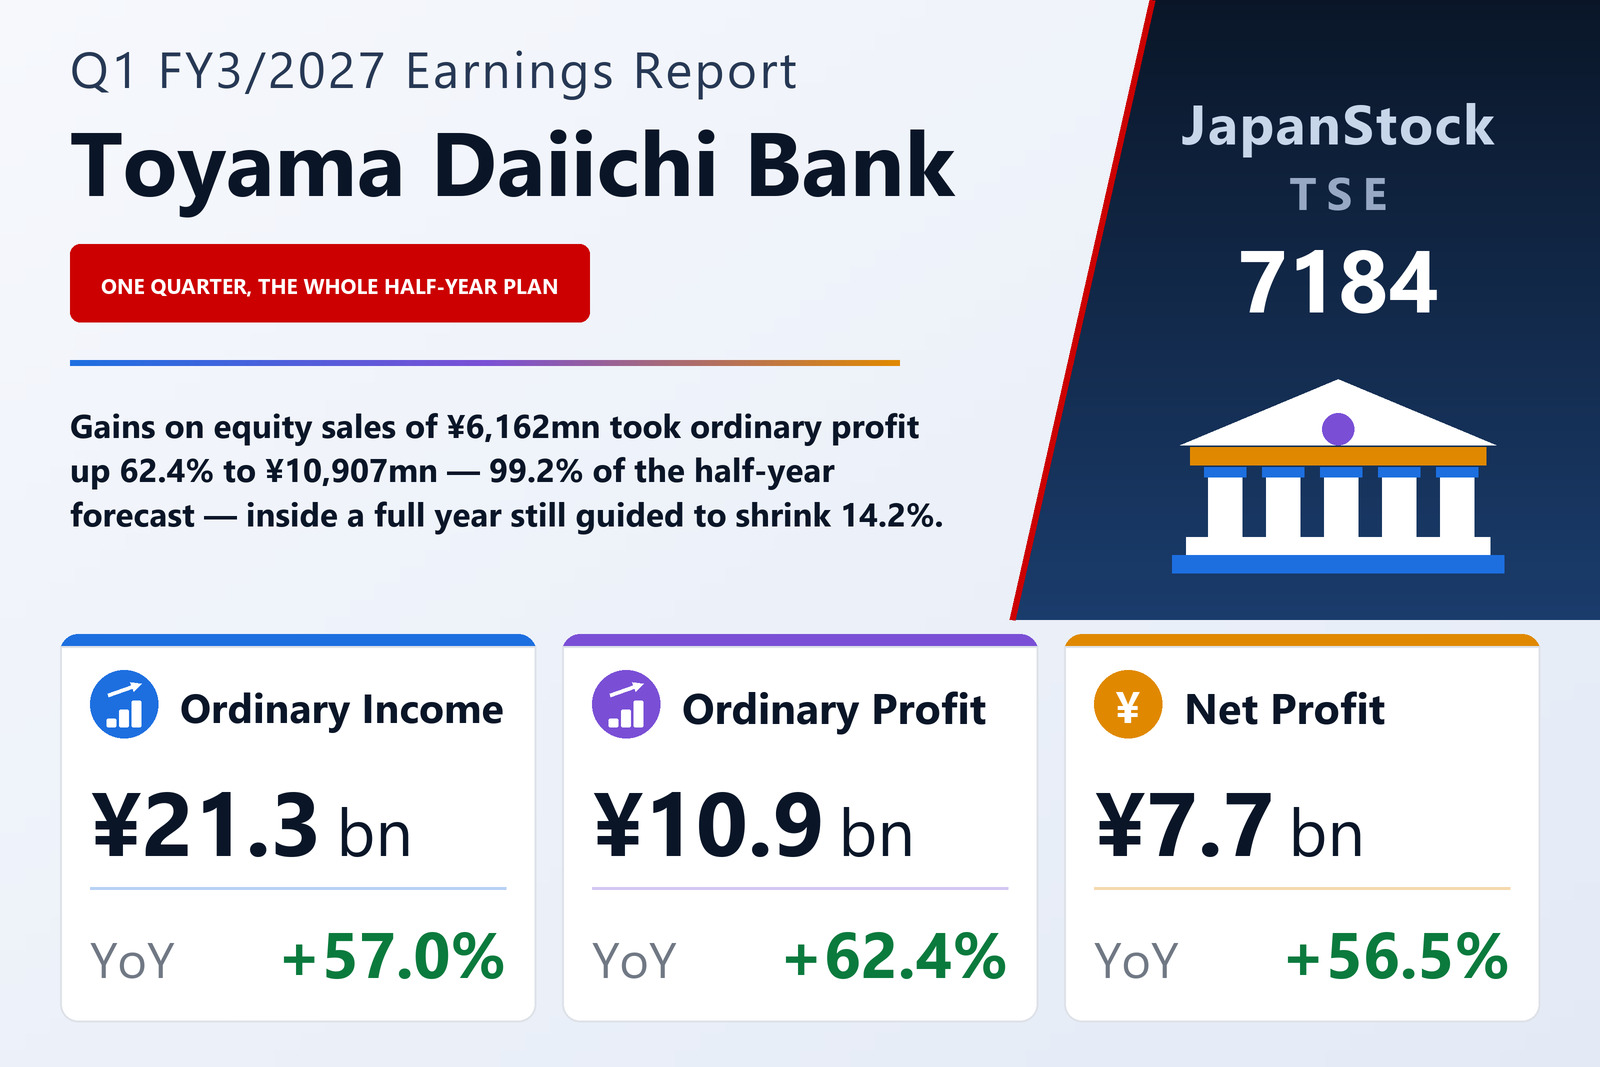
The Toyama Daiichi Bank, Ltd. (TSE: 7184), the Toyama-based regional lender, published consolidated results for the three months to June 30, 2026 on August 3, 2026 under Japanese GAAP. Ordinary income rose 57.0% to ¥21,306 million, ordinary profit 62.4% to ¥10,907 million and net profit attributable to owners of the parent 56.5% to ¥7,692 million. Earnings per share reached ¥124.51 against ¥77.53 — up 60.6%, outpacing net profit because the bank bought back and cancelled shares during the quarter.
The comparison flatters: a year earlier ordinary income had fallen 29.0% and ordinary profit 41.9%, so this quarter grew off a depressed base. Ordinary income gained ¥7,735 million on higher interest income, up 26.2% to ¥9,302 million, and higher other ordinary income, up 142.8% to ¥7,450 million — the latter carrying the gains on sales of equities. Ordinary expenses rose 51.7% to ¥10,398 million on higher deposit interest and larger losses on sales of bonds, including Japanese government bonds.
Where the profit came from
The bank's supplementary disclosure, on a non-consolidated basis, splits the result in two. Core banking work contributed little: gross business profit rose ¥525 million to ¥8,219 million as net interest income gained ¥1,074 million, while expenses rose ¥212 million to ¥3,399 million on wage increases and system investment, leaving net business profit just ¥313 million higher at ¥4,819 million. Non-recurring items supplied the rest, rising ¥3,842 million to ¥6,462 million — of which equity-related gains and losses accounted for ¥6,162 million, up ¥3,651 million, against a ¥128 million bond loss where a year earlier there was a ¥576 million gain. Credit costs were a net ¥260 million reversal.
By reportable segment, Banking produced ordinary income of ¥19,437 million (+55.0%) and segment profit of ¥11,283 million (+58.3%). Leasing added ¥2,310 million and ¥62 million, and the Other segment — credit cards, money lending and the management of investment limited partnerships — ¥381 million and ¥143 million, both more than doubling from a small base.
The gain came out of the valuation reserve
Comprehensive income moved the other way, falling 66.8% to ¥2,624 million while net profit rose 56.5%. Other comprehensive income swung to minus ¥5,067 million from plus ¥2,993 million, almost all of it the valuation difference on available-for-sale securities at minus ¥4,994 million against plus ¥2,955 million. The same reserve on the balance sheet fell from ¥69,074 million to ¥64,079 million, and total unrealised gains on the securities book stood at ¥84,014 million at June 30 against ¥88,983 million at March 31 — still ¥37,983 million above a year earlier.
Total assets fell 1.0% to ¥1,684,137 million. Securities did most of the shrinking, down 11.8% to ¥490,298 million as the bank switched bonds into rising long-term yields, and loans fell 1.5% to ¥1,017,358 million. Deposits including negotiable certificates of deposit edged up 0.4% to ¥1,443,778 million. Under a May 12, 2026 board resolution the bank also acquired 2,000,000 of its own shares and cancelled 1,309,700, cutting shares outstanding to 63,000,000. Net assets fell 3.0% to ¥192,675 million and the equity ratio to 11.4% from 11.7% — a figure the filing states plainly is net assets divided by total assets and not the regulatory capital-adequacy ratio, which stood at 13.14% on a consolidated basis, up 0.25 points on the year.
Guidance untouched, and pointing down
Guidance published on May 12, 2026 is unchanged. For the first half the bank forecasts ordinary profit of ¥11,000 million (+8.9%) and net profit of ¥8,000 million (+9.5%); for the full year to March 2027, ordinary profit of ¥18,000 million, down 14.2%, net profit of ¥13,000 million, down 13.7%, and earnings per share of ¥212.83. The arithmetic is worth stating on its own: the first quarter alone has delivered 99% of the half-year ordinary-profit forecast and 96% of the half-year net-profit forecast, and 61% and 59% of the respective full-year figures. The filing offers no explanation for that gap, and the forecast was not revised.
The dividend forecast is unchanged too, and it is not a raise. The bank guides ¥75.00 a share for FY3/2027, split ¥37.50 interim and ¥37.50 final, against ¥84.00 paid for FY3/2026 — an interim payment up from ¥28.00 but a year-end payment down from ¥56.00. The tanshin gives no breakdown of last year's ¥56.00 final payment and records no special or commemorative component.
| Metric | Q1 FY3/2027 | Q1 FY3/2026 | Change |
|---|---|---|---|
| Ordinary income (¥ million) | 21,306 | 13,571 | +57.0% |
| — interest income (¥ million) | 9,302 | 7,372 | +26.2% |
| — other ordinary income (¥ million) | 7,450 | 3,068 | +142.8% |
| Ordinary expenses (¥ million) | 10,398 | 6,855 | +51.7% |
| Ordinary profit (¥ million) | 10,907 | 6,716 | +62.4% |
| Net profit attrib. to owners of parent (¥ million) | 7,692 | 4,914 | +56.5% |
| Comprehensive income (¥ million) | 2,624 | 7,908 | −66.8% |
| EPS (¥) | 124.51 | 77.53 | +60.6% |
| Banking — revenue (¥ million) | 19,437 | 12,538 | +55.0% |
| Banking — segment profit (¥ million) | 11,283 | 7,128 | +58.3% |
| Leasing — revenue (¥ million) | 2,310 | 1,555 | +48.6% |
| Leasing — segment profit (¥ million) | 62 | 25 | +148.0% |
| Other — revenue (¥ million) | 381 | 169 | +125.4% |
| Other — segment profit (¥ million) | 143 | 45 | +217.8% |
| Total assets (¥ million) | 1,684,137 | 1,701,560 | −1.0% |
| Loans and bills discounted (¥ million) | 1,017,358 | 1,033,018 | −1.5% |
| Securities (¥ million) | 490,298 | 556,039 | −11.8% |
| Deposits, incl. negotiable CDs (¥ million) | 1,443,778 | 1,437,719 | +0.4% |
| Net assets (¥ million) | 192,675 | 198,570 | −3.0% |
| Equity ratio | 11.4% | 11.7% | −0.3 pt |
| FY3/2027 guidance — ordinary profit (¥ million) | 18,000 | — | −14.2% |
| FY3/2027 guidance — net profit (¥ million) | 13,000 | — | −13.7% |
| FY3/2027 guidance — EPS (¥) | 212.83 | — | n.m. |
| Annual dividend per share (¥) | 75.00 | 84.00 | −10.7% |
JapanStockPulse provides informational content only and does not constitute investment advice. Figures are taken from the company's published earnings short report and may be subject to subsequent revision.