Fewer vehicles, more revenue
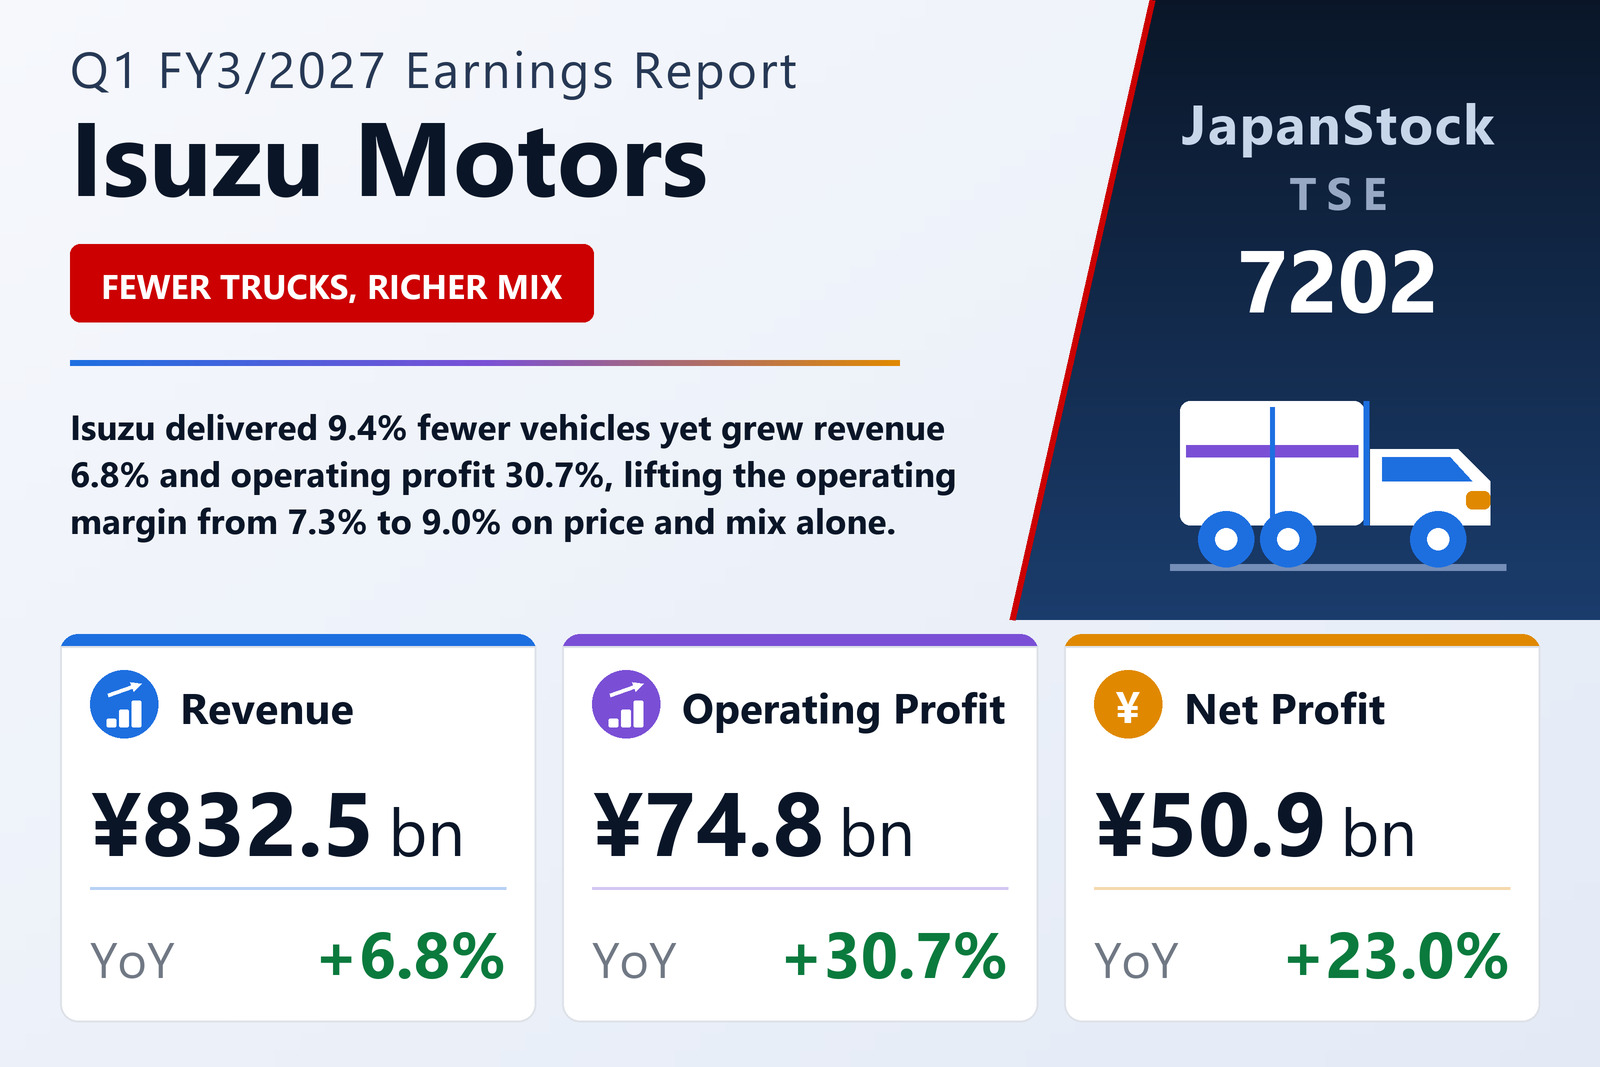
Isuzu Motors Limited (TSE: 7202), the truck, bus and diesel-engine maker, published consolidated results for the three months to June 30, 2026 on August 3, 2026 under IFRS. Revenue rose 6.8% to ¥832,519 million, operating profit 30.7% to ¥74,761 million, pre-tax profit 26.8% to ¥81,431 million and profit attributable to owners of the parent 23.0% to ¥50,938 million. Gross profit rose 20.2% to ¥187,872 million, lifting the gross margin to 22.6% from 20.0%; selling, general and administrative expenses rose 18.0% to ¥117,114 million, and the operating margin still improved to 9.0% from 7.3%.
The volume line runs the other way. Isuzu delivered 126,272 vehicles, 13,097 fewer than a year earlier and down 9.4%, yet vehicle revenue rose 6.2% to ¥589,473 million. The company splits the table three ways, with CV meaning trucks and buses and LCV meaning pickup trucks and their derivatives. Heavy and medium CVs were the only category to add units, up 1.8% to 21,073, with revenue up 10.0% to ¥203,398 million. Light-duty CVs fell 10.1% to 48,357 units while their revenue rose 3.9% to ¥184,124 million. LCVs, which Isuzu sells entirely outside Japan, fell 12.4% to 56,842 units while their revenue rose 4.7% to ¥201,950 million.
The regional split sharpens the point. The filing groups sales into Japan, North America (the United States), Asia (Thailand, China, Indonesia and the Philippines) and other markets (Australia, Saudi Arabia, Mexico, the United Arab Emirates and Colombia). Vehicle revenue in North America rose 25.4% to ¥41,217 million on 3.8% fewer units; in Asia it rose 22.3% to ¥126,398 million on 8.6% more units; in the other overseas markets it rose only 2.0% to ¥274,601 million while unit deliveries there fell 17.6%; and in Japan it slipped 1.5% to ¥147,255 million on 10.4% fewer units. Adding industrial engines, up 22.3% to ¥33,998 million, and the remaining businesses, up 6.1% to ¥209,047 million, total overseas revenue rose 9.4% to ¥522,827 million, or 62.8% of the group, against ¥309,691 million in Japan, up 2.6%. The tanshin itself carries no management commentary on demand, tariffs or currencies — Isuzu directs readers to the results presentation published the same day.
Two reporting segments, and one is 94% of revenue
Isuzu split what had been a single reporting segment into Automotive and Financial Services at the end of the last fiscal year, and the prior-year quarter has been restated on the new basis. Automotive — commercial vehicles, LCVs, powertrains and related parts — booked ¥785,281 million of revenue from external customers, up 6.4%, and segment profit of ¥71,180 million, up 32.5%. Financial Services, which finances and leases the group's vehicles, booked ¥47,237 million from external customers, up 12.9%, and segment profit of ¥3,255 million, up 4.7%. Segment profit is defined as operating profit, so the two plus a ¥326 million consolidation adjustment give the group's ¥74,761 million. Financial Services held ¥415,036 million of lease receivables and vehicles for lease at quarter end, up 10.8% year on year, and carried ¥386,848 million of the group's ¥1,010,996 million of interest-bearing debt.
The China engine venture leaves the consolidation
One company left the consolidated group in the quarter and none joined: Isuzu (China) Engine Co., Ltd. (いすゞ(中国)発動機有限公司), based in Chongqing. Isuzu's management meeting resolved on December 19, 2025 to run it jointly with its local partners Qingling Motors (Group) Co., Ltd. (慶鈴汽車(集団)有限公司) and Qingling Motors Co., Ltd. (慶鈴汽車股份有限公司); shareholders approved on February 13, 2026 and the local procedures completed on April 30, 2026. From this quarter it is an equity-method associate rather than a subsidiary. The traces run across the statements: investments accounted for using the equity method rose ¥17,652 million to ¥148,918 million, non-controlling interests fell ¥19,415 million on the loss of control, ¥8,572 million of cash left with the company, and the share of profit of equity-method investees fell 29.6% to ¥1,973 million. The filing does not quantify what the deconsolidation did to revenue or operating profit.
A quarter of cash outflow the company calls temporary
Operating cash flow was an outflow of ¥45,272 million against a ¥63,433 million inflow a year earlier — a ¥108,705 million swing in a quarter whose pre-tax profit was ¥17,221 million higher. Working capital accounts for it. Trade and other payables fell ¥111,684 million, of which roughly ¥90,000 million is a planned shortening of payment terms to suppliers, and inventories rose ¥71,894 million, of which roughly ¥35,000 million is a temporary build of finished goods behind shipping delays tied to the situation in the Middle East and a shortage of vessels serving several markets. Receivables released ¥61,538 million and income taxes took ¥16,437 million. Isuzu states that both the payment-term change and the inventory build are one-off factors concentrated in this quarter. Investing used ¥64,159 million, up 108.6%, on ¥51,659 million of purchases of property, plant and equipment; segment capital expenditure rose 32.3% to ¥59,551 million. Financing raised ¥106,387 million, mainly ¥123,000 million of commercial paper and ¥53,089 million of long-term borrowing against ¥31,192 million of dividends paid and ¥25,272 million of long-term debt repaid. Cash and equivalents ended the quarter at ¥391,117 million.
Total assets rose 1.1% to ¥3,702,996 million, with inventories up ¥79,416 million and trade receivables down ¥60,182 million. Liabilities rose ¥23,745 million to ¥2,022,896 million: trade and other payables down ¥130,800 million, interest-bearing debt up ¥153,600 million to ¥1,010,996 million. Equity rose ¥16,114 million to ¥1,680,100 million — the quarter's profit less ¥31,615 million of dividends and an ¥11,909 million reduction in non-controlling interests — and the ratio of equity attributable to owners of the parent improved to 40.7% from 40.4%. Comprehensive income rose 66.2% to ¥72,389 million, almost entirely because the foreign-currency translation reserve swung from a ¥9,068 million loss to an ¥11,912 million gain.
Guidance untouched, and one line in it deserves a look
The full-year forecast issued on May 13, 2026 is unchanged: revenue of ¥3,700,000 million (+6.4%), operating profit of ¥260,000 million (+27.6%), pre-tax profit of ¥260,000 million (+12.8%), profit attributable to owners of the parent of ¥160,000 million (+18.6%) and earnings per share of ¥232.82. The first quarter has therefore delivered 22.5% of the guided revenue, 28.8% of the guided operating profit and 31.8% of the guided net profit. Isuzu publishes no half-year guidance against which to read that run rate, and its own note says the forecast assumes a particular timing for a recovery in demand. One line is worth flagging: operating profit and pre-tax profit are both guided at ¥260,000 million, which implies net financial and other non-operating items of about zero across the year — against a positive ¥6,670 million in this quarter alone. The filing offers no explanation for the assumption.
The dividend forecast is unchanged too, at ¥94.00 for the year, split ¥47.00 interim and ¥47.00 final, against ¥92.00 paid for FY3/2026. Earnings per share of ¥74.12 against ¥58.18 grew 27.4%, ahead of the 23.0% rise in the profit behind it, because the average share count fell 3.5% to 687,236,735 after buybacks. Isuzu reports no material subsequent events.
| Metric | Q1 FY3/2027 | Q1 FY3/2026 | Change |
|---|---|---|---|
| Revenue (¥ million) | 832,519 | 779,854 | +6.8% |
| Gross profit (¥ million) | 187,872 | 156,276 | +20.2% |
| Gross margin | 22.6% | 20.0% | +2.5 pt |
| SG&A expenses (¥ million) | 117,114 | 99,216 | +18.0% |
| Operating profit (¥ million) | 74,761 | 57,222 | +30.7% |
| Operating margin | 9.0% | 7.3% | +1.6 pt |
| Pre-tax profit (¥ million) | 81,431 | 64,210 | +26.8% |
| Net profit (¥ million) | 62,662 | 50,320 | +24.5% |
| Net profit attrib. to owners of parent (¥ million) | 50,938 | 41,417 | +23.0% |
| Comprehensive income (¥ million) | 72,389 | 43,557 | +66.2% |
| EPS (¥) | 74.12 | 58.18 | +27.4% |
| Automotive — revenue (¥ million) | 785,281 | 738,004 | +6.4% |
| Automotive — segment profit (¥ million) | 71,180 | 53,735 | +32.5% |
| Financial Services — revenue (¥ million) | 47,237 | 41,849 | +12.9% |
| Financial Services — segment profit (¥ million) | 3,255 | 3,108 | +4.7% |
| Vehicle sales (units) | 126,272 | 139,369 | −9.4% |
| Overseas revenue (¥ million) | 522,827 | 477,885 | +9.4% |
| Total assets (¥ million) | 3,702,996 | 3,663,138 | +1.1% |
| Equity attrib. to owners of parent (¥ million) | 1,507,532 | 1,479,509 | +1.9% |
| Equity ratio | 40.7% | 40.4% | +0.3 pt |
| FY3/2027 guidance — revenue (¥ million) | 3,700,000 | — | +6.4% |
| FY3/2027 guidance — operating profit (¥ million) | 260,000 | — | +27.6% |
| FY3/2027 guidance — pre-tax profit (¥ million) | 260,000 | — | +12.8% |
| FY3/2027 guidance — net profit (¥ million) | 160,000 | — | +18.6% |
| FY3/2027 guidance — EPS (¥) | 232.82 | — | n.m. |
| Annual dividend per share (¥) | 94.00 | 92.00 | +2.2% |
JapanStockPulse provides informational content only and does not constitute investment advice. Figures are taken from the company's published earnings short report and may be subject to subsequent revision.