Profit growth that happens below the operating line
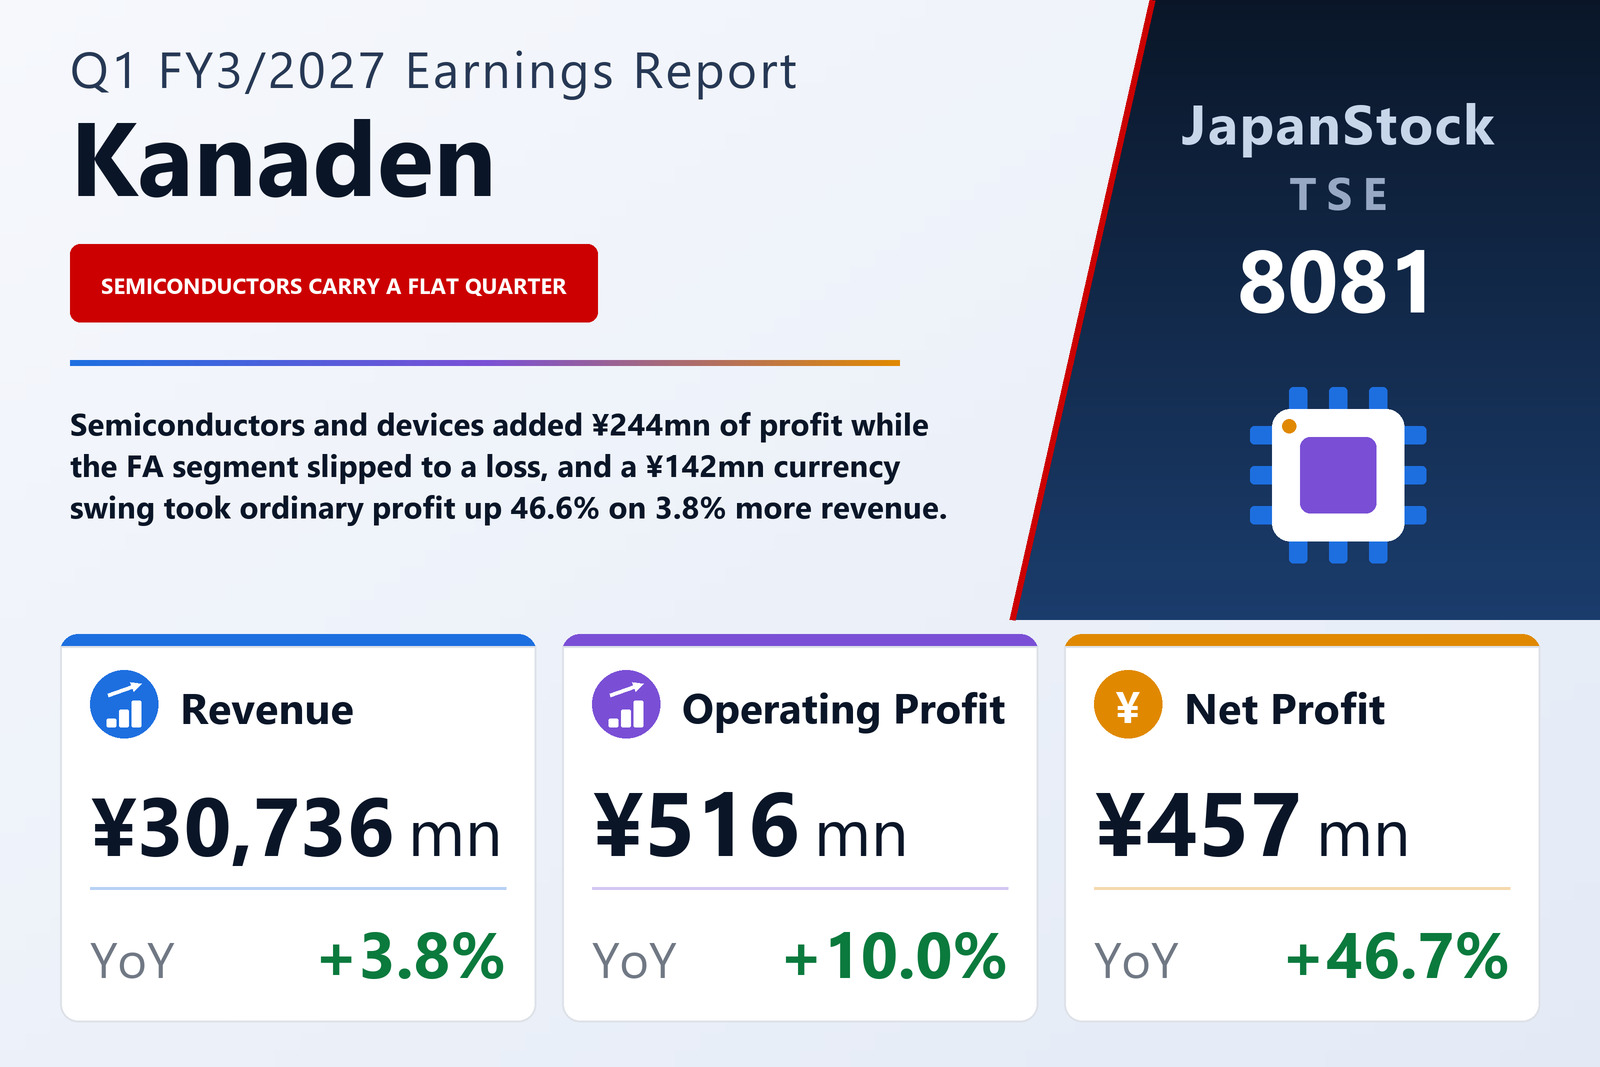
Kanaden Corporation (TSE: 8081), the Tokyo-listed technical trading company that distributes Mitsubishi Electric factory-automation, building, semiconductor and infrastructure products, published consolidated results for the three months to June 30, 2026 on August 3, 2026 under Japanese GAAP. Revenue rose 3.8% to ¥30,736 million, an increase of ¥1,127 million, and operating profit 10.0% to ¥516 million, up ¥46 million. Below that line the picture changes: ordinary profit rose 46.6% to ¥707 million, up ¥224 million, and net profit attributable to owners of the parent 46.7% to ¥457 million, up ¥145 million, for earnings per share of ¥20.51 against ¥13.99. Comprehensive income was ¥1,049 million, up 182.3%. The prior-year quarter has been restated to reflect the finalisation of provisional accounting for a business combination, completed in the third quarter of FY3/2026.
The gap between a 10.0% operating gain and a 46.6% ordinary gain is entirely non-operating. Non-operating income rose to ¥199 million from ¥112 million while non-operating expenses collapsed to ¥7 million from ¥98 million, so the net non-operating contribution went from ¥14 million to ¥192 million. Currency is most of it: the prior-year quarter carried a ¥90 million foreign-exchange loss and this one a ¥52 million foreign-exchange gain, a swing of ¥142 million with no equivalent on the operating line. Dividends received rose to ¥88 million from ¥60 million and purchase discounts to ¥30 million from ¥19 million, while interest expense was ¥3 million against ¥4 million. Extraordinary items barely register — a retirement loss on fixed assets of under ¥1 million this year, none a year ago — and income taxes totalled ¥250 million against ¥171 million.
Four segments redrawn, and the semiconductor business now carries the profit
Kanaden reorganised its reporting segments this quarter. The previous four were recast into FA Systems, Building Equipment, Semiconductors & Devices and Social Infrastructure, and segment profit was switched from ordinary profit to operating profit. Prior-year segment figures have been restated on the new basis, so the comparisons here are like for like. Semiconductors & Devices is the profit engine: revenue up 25.8% to ¥5,984 million, a gain of ¥1,227 million, and segment profit up 60.6% to ¥649 million, a gain of ¥244 million. Power devices for industrial equipment struggled on weaker demand, but Wi-Fi modules for home appliances and electronic devices for office equipment held up. Social Infrastructure returned to profit at ¥93 million from an ¥8 million loss on revenue up 1.9% to ¥8,609 million, as railway operators kept investing in wireless-communication and rolling-stock equipment and defence-related orders rose, more than offsetting fewer electronic medical device projects.
The two other segments went the other way. FA Systems, the largest by revenue, grew the top line 7.7% to ¥14,366 million, a gain of ¥1,031 million, but slipped to a segment loss of ¥19 million from a ¥207 million profit. Controller systems and drive-control equipment were firm as the drag from inventory adjustment eased, and power-distribution and control equipment for data centres progressed well; against that, laser processing machine projects declined, industrial systems fell on the absence of a large prior-year order, and the company says the segment reorganisation itself also contributed to the ¥226 million profit decline. Building Equipment was the weakest line: revenue down 42.1% to ¥1,776 million, a fall of ¥1,289 million, and the segment loss widening to ¥207 million from ¥133 million, as power installations for telecommunications carriers fell against a large prior-year order and imaging and video equipment for the distribution sector was weak.
A balance sheet ¥12.3 billion smaller in three months
Total assets fell ¥12,336 million to ¥85,626 million against March 31, 2026. Almost all of it is a fiscal-year-end working-capital position unwinding: notes and accounts receivable and contract assets fell ¥10,625 million and cash and deposits ¥5,782 million, partly offset by advance payments up ¥1,388 million, merchandise and finished goods up ¥1,050 million and electronically recorded receivables up ¥555 million. The other side matches. Current liabilities fell ¥13,075 million to ¥33,160 million, driven by notes and accounts payable down ¥13,310 million, income taxes payable down ¥1,473 million and the bonus provision down ¥958 million, against advances received up ¥2,857 million. Net assets edged up ¥253 million to ¥51,172 million: ¥457 million of net profit against ¥802 million of dividends paid left retained earnings ¥345 million lower, while unrealised gains on securities added ¥538 million. Because the denominator shrank and equity did not, the equity ratio jumped 7.7 points to 59.7% from 52.0%, and net assets per share edged up to ¥2,295.56 from ¥2,283.12.
Guidance untouched, the dividend guided up 38.9%
Kanaden left the forecasts it published on May 13, 2026 unchanged. For the first half it expects revenue of ¥63,000 million (+2.2%), operating profit of ¥1,700 million (+1.4%), ordinary profit of ¥1,800 million (−0.4%) and net profit of ¥1,200 million (+0.2%), for earnings per share of ¥53.83. For the full year it expects revenue of ¥150,000 million (+3.0%), operating profit of ¥5,900 million (+10.7%), ordinary profit of ¥6,000 million (+3.7%) and net profit of ¥4,000 million (+0.9%), for earnings per share of ¥179.43. The quarter has therefore already delivered ¥707 million of the ¥6,000 million full-year ordinary profit, and ¥457 million of the ¥4,000 million net figure. The annual dividend is guided to ¥100.00 from ¥72.00, a 38.9% increase, split ¥50.00 interim and ¥50.00 final. The group is in the first year of a three-year mid-term plan it calls True Solution 2028.
| Metric | Q1 FY3/2027 | Q1 FY3/2026 | Change |
|---|---|---|---|
| Revenue (¥ million) | 30,736 | 29,609 | +3.8% |
| Gross profit (¥ million) | 3,966 | 3,800 | +4.4% |
| Operating profit (¥ million) | 516 | 469 | +10.0% |
| Operating margin | 1.7% | 1.6% | +0.1 pt |
| Ordinary profit (¥ million) | 707 | 483 | +46.6% |
| Net profit attrib. to owners of parent (¥ million) | 457 | 311 | +46.7% |
| Comprehensive income (¥ million) | 1,049 | 371 | +182.3% |
| EPS (¥) | 20.51 | 13.99 | +46.6% |
| FA Systems — revenue (¥ million) | 14,366 | 13,334 | +7.7% |
| FA Systems — segment profit (¥ million) | −19 | 207 | profit to loss |
| Building Equipment — revenue (¥ million) | 1,776 | 3,065 | −42.1% |
| Building Equipment — segment profit (¥ million) | −207 | −133 | loss widened |
| Semiconductors & Devices — revenue (¥ million) | 5,984 | 4,756 | +25.8% |
| Semiconductors & Devices — segment profit (¥ million) | 649 | 404 | +60.6% |
| Social Infrastructure — revenue (¥ million) | 8,609 | 8,452 | +1.9% |
| Social Infrastructure — segment profit (¥ million) | 93 | −8 | loss to profit |
| Total assets (¥ million) | 85,626 | 97,962 | −12.6% |
| Net assets (¥ million) | 51,172 | 50,918 | +0.5% |
| Shareholders' equity (¥ million) | 51,156 | 50,903 | +0.5% |
| Equity ratio | 59.7% | 52.0% | +7.7 pt |
| FY3/2027 guidance — revenue (¥ million) | 150,000 | — | +3.0% |
| FY3/2027 guidance — operating profit (¥ million) | 5,900 | — | +10.7% |
| FY3/2027 guidance — ordinary profit (¥ million) | 6,000 | — | +3.7% |
| FY3/2027 guidance — net profit (¥ million) | 4,000 | — | +0.9% |
| FY3/2027 guidance — EPS (¥) | 179.43 | — | n.m. |
| Annual dividend per share (¥) | 100.00 | 72.00 | +38.9% |
JapanStockPulse provides informational content only and does not constitute investment advice. Figures are taken from the company's published earnings short report and may be subject to subsequent revision.