Sales added ¥4,307 million; gross profit added ¥185 million
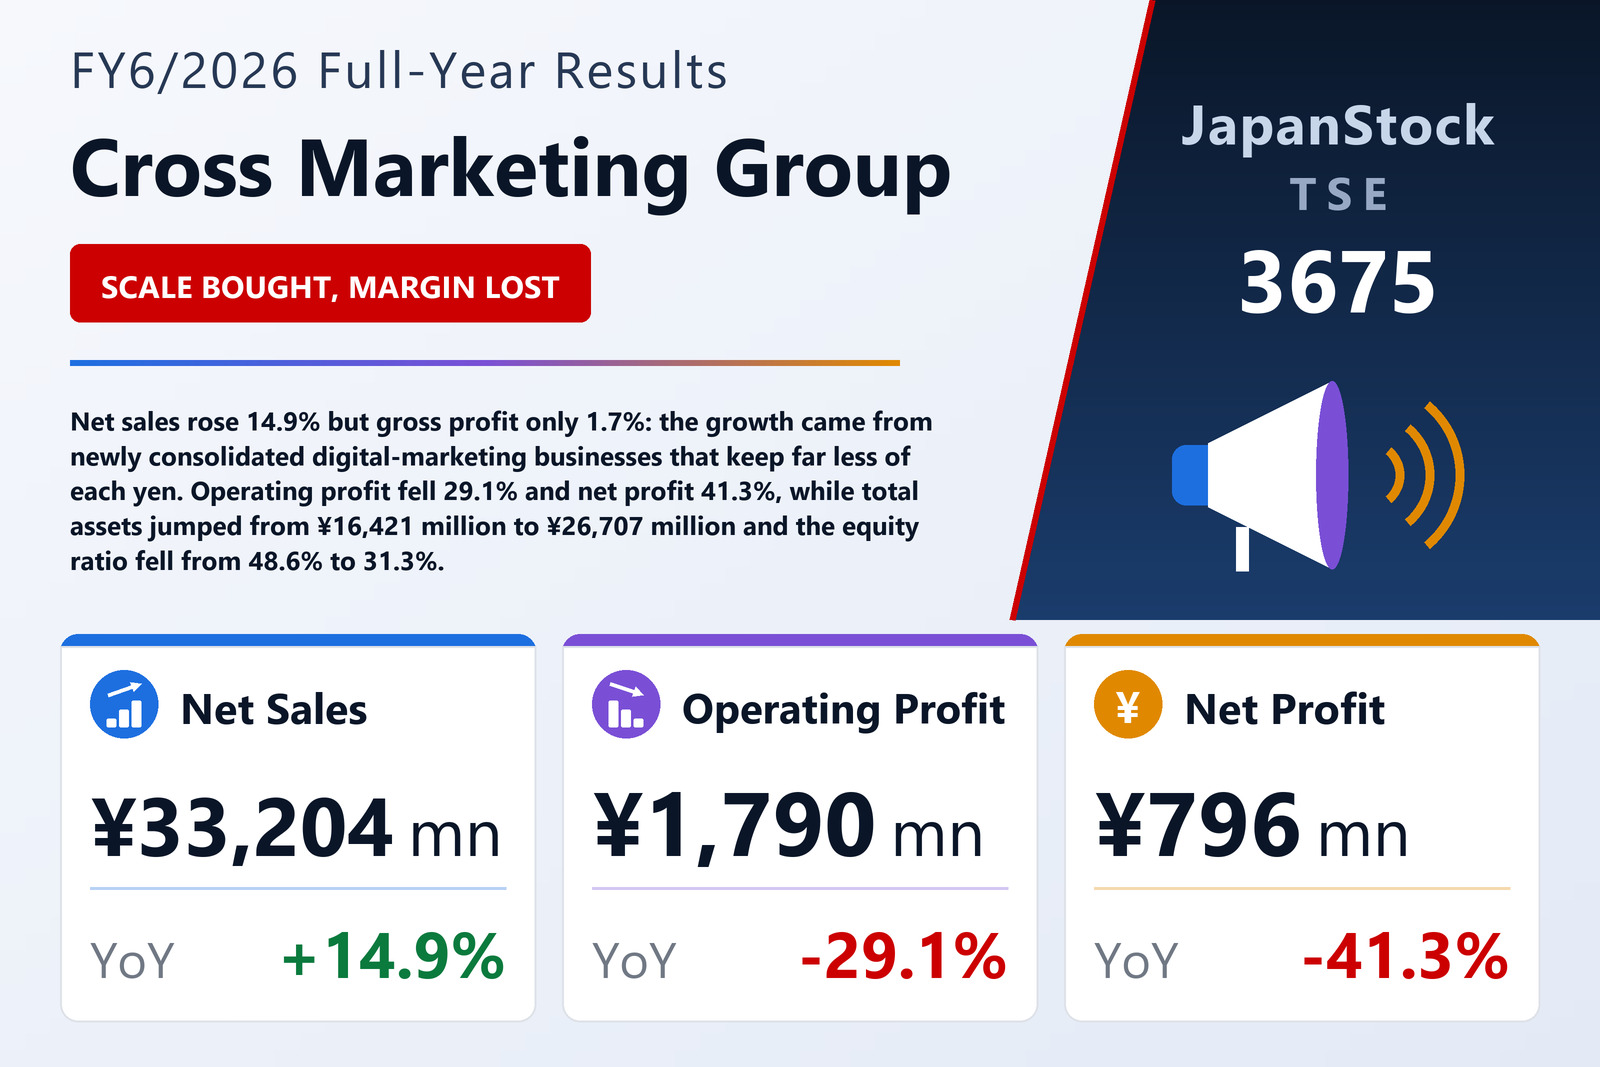
Cross Marketing Group Inc. (TSE: 3675), the Tokyo-based holding company whose subsidiaries run marketing-research panels in Japan and abroad alongside a domestic digital-promotion business, published full-year consolidated results for FY6/2026 — July 1, 2025 to June 30, 2026 — on August 10, 2026 under Japanese GAAP. Net sales rose 14.9% to ¥33,204 million, but operating profit fell 29.1% to ¥1,790 million, ordinary profit 24.6% to ¥1,809 million and net profit attributable to owners of the parent 41.3% to ¥796 million. Earnings per share were ¥41.19 against ¥71.47, return on equity 9.7% against 18.0%, and the operating margin 5.4% against 8.7%.
The whole of the operating-profit decline sits in two lines of the income statement. Gross profit rose only 1.7%, from ¥11,072 million to ¥11,257 million — ¥185 million more gross profit on ¥4,307 million more sales, so the gross margin fell from 38.3% to 33.9%. Selling, general and administrative expenses rose 10.7%, from ¥8,550 million to ¥9,467 million, an increase of ¥918 million. Subtract the second from the first and the ¥733 million fall in operating profit is fully accounted for: nothing below the gross-profit line and nothing exceptional is needed to explain it. Goodwill amortisation, which runs through SG&A, was ¥314 million against ¥257 million, so it is part of that increase but only a small part of it.
The growth came from the lower-margin half of the group
Digital Marketing lifted external sales 33.1% to ¥16,670 million and segment profit 14.4% to ¥1,030 million. Within it, Social & Digital Promotion grew 42.1% to ¥11,731 million on influencer and IP-promotion work plus the first-time consolidation of DIGITALIO Inc. and Startling (スタートリング); SI & DX Consulting grew 14.2% to ¥2,421 million, with existing system-development work roughly flat and the increase coming from newly consolidated Coum Inc.; and Marketing HR grew 17.5% to ¥2,519 million. Research & Insight, the older half of the company, grew external sales just 1.0% to ¥16,534 million and saw segment profit fall 19.8% to ¥3,067 million — domestic sales up 2.3% to ¥11,711 million, overseas sales down 2.1% to ¥4,823 million as the United States grew but the United Kingdom, India and Indonesia struggled. The company attributes that segment's profit decline to the stalled overseas top line and to higher SG&A.
The margin arithmetic follows from the segment table, though the filing does not print the ratios. Digital Marketing earned ¥1,030 million on ¥17,745 million of segment sales including internal transfers, a margin of 5.8%; Research & Insight earned ¥3,067 million on ¥17,189 million, a margin of 17.8% — three times as much kept per yen. Digital Marketing went from 43.3% of external sales to 50.2% of them in one year, so the group's mix moved decisively toward the business that keeps less, which is why a 14.9% sales year produced a 1.7% gross-profit year. Reported segment profits still total ¥4,097 million; unallocated corporate costs and intersegment eliminations of −¥2,307 million, against −¥2,200 million a year earlier, bring that down to the ¥1,790 million on the income statement.
Below operating profit, tax took the rest
Ordinary profit fell less steeply than operating profit because non-operating items swung from a net cost of ¥123 million to a net gain of ¥19 million. The swing is mostly currency: a ¥74 million foreign-exchange loss became a ¥47 million gain. The year also added ¥30 million of gains on sales of investment securities, ¥33 million of insurance cancellation refunds and ¥30 million of equity-method income, against ¥90 million of interest paid (¥77 million a year earlier) and a ¥23 million bad-debt provision. Extraordinary items then cost ¥97 million net — gains of ¥20 million, being ¥16 million on step acquisitions and ¥3 million of negative goodwill, against losses of ¥117 million, of which ¥62 million was an impairment charge booked entirely in Digital Marketing, ¥50 million a write-down of investment securities and ¥3 million fixed-asset retirements. Pre-tax profit was ¥1,712 million, down 26.8%.
The gap between a 26.8% fall in pre-tax profit and a 41.3% fall in attributable net profit is tax. Income taxes were ¥916 million against ¥982 million — down only 6.6% on a pre-tax profit that fell more than a quarter. Dividing the one by the other gives an effective rate of 53.5% against 42.0%; neither ratio is printed in the filing, and it is the single largest reason the bottom line fell almost twice as fast as the operating line. Comprehensive income was ¥928 million, down 26.3%: other comprehensive income of ¥133 million — ¥140 million of foreign-currency translation less ¥7 million on available-for-sale securities — was added to net profit.
Total assets rose 62.6% and the equity ratio fell 17.3 points
The consolidations reshaped the balance sheet. Total assets rose 62.6%, from ¥16,421 million to ¥26,707 million, while net assets rose only 4.7% to ¥8,366 million, so the equity ratio fell from 48.6% to 31.3%. Current assets rose ¥9,677 million to ¥22,547 million, cash and deposits alone accounting for ¥11,478 million and trade receivables ¥5,523 million. Current liabilities rose ¥8,586 million to ¥14,003 million, and two lines that were rounding errors a year ago now carry much of that increase: deposits received of ¥4,489 million against ¥70 million, and a point provision of ¥448 million against ¥76 million — the shape of a promotion-media business that holds customer balances, arriving with the newly consolidated companies. Goodwill on the balance sheet rose to ¥1,506 million from ¥1,176 million, all of it carried in Digital Marketing, and long-term borrowings to ¥3,888 million from ¥2,666 million.
Cash flow is the year's oddity. Operating cash flow was ¥1,854 million, close to the prior year's ¥1,956 million despite the far smaller pre-tax profit, because ¥264 million of depreciation, ¥314 million of goodwill amortisation and the ¥62 million impairment are all non-cash. Investing cash flow was positive, at ¥782 million, against an outflow of ¥480 million — not because the group stopped investing but because ¥1,825 million of loans receivable was repaid, more than covering ¥596 million paid to acquire a subsidiary, ¥414 million of securities purchases and ¥339 million of capital expenditure. Financing added ¥1,064 million, on ¥3,000 million of new long-term borrowing against ¥1,272 million of repayments, ¥380 million of share buybacks and ¥280 million of dividends paid. Cash and equivalents ended the year at ¥11,478 million, up ¥3,844 million.
Guidance asks for a 39.7% rebound in operating profit
For FY6/2027 the company plans net sales of ¥40,000 million (+20.5%), operating profit of ¥2,500 million (+39.7%), ordinary profit of ¥2,500 million (+38.2%) and attributable net profit of ¥1,300 million (+63.4%), for earnings per share of ¥67.30. The plan is split by segment: Digital Marketing ¥23,000 million, up 38.0%, and Research & Insight ¥17,000 million, up 2.8%. The mix shift the group has just absorbed is therefore planned to continue and accelerate — Digital Marketing would end the year well clear of Research & Insight — while operating profit is planned to recover almost to the ¥2,523 million of FY6/2025. The filing does not explain where that margin recovery comes from: it neither says the acquisition-related cost drag will not repeat nor quantifies a synergy.
The dividend for FY6/2026 is ¥15.00 per share (¥7.50 interim, ¥7.50 final), ¥1.00 more than the ¥14.00 paid for FY6/2025, costing ¥286 million against ¥267 million. The payout ratio rose to 36.4% from 19.6% because earnings fell rather than because the payout policy changed, while the dividend-on-equity ratio slipped to 3.5% from 3.6%. FY6/2027 is guided at ¥16.00, a 23.8% payout. Separately, at the same August 10, 2026 board meeting, the company resolved to buy back up to 500,000 shares — 2.7% of shares outstanding excluding treasury stock — for up to ¥300 million, on the Tokyo market between August 12, 2026 and February 10, 2027. It had already bought ¥380 million of its own shares during FY6/2026, lifting treasury holdings to 1,217,201 shares from 718,401.
| Metric | FY6/2026 | FY6/2025 | Change |
|---|---|---|---|
| Net sales (¥ million) | 33,204 | 28,897 | +14.9% |
| Gross profit (¥ million) | 11,257 | 11,072 | +1.7% |
| Gross margin | 33.9% | 38.3% | −4.4 pt |
| SG&A expenses (¥ million) | 9,467 | 8,550 | +10.7% |
| Operating profit (¥ million) | 1,790 | 2,523 | −29.1% |
| Operating margin | 5.4% | 8.7% | −3.3 pt |
| Ordinary profit (¥ million) | 1,809 | 2,400 | −24.6% |
| Pre-tax profit (¥ million) | 1,712 | 2,338 | −26.8% |
| Income taxes (¥ million) | 916 | 982 | −6.6% |
| Net profit attrib. to owners of parent (¥ million) | 796 | 1,356 | −41.3% |
| Comprehensive income (¥ million) | 928 | 1,260 | −26.3% |
| EPS (¥) | 41.19 | 71.47 | −42.4% |
| Return on equity | 9.7% | 18.0% | −8.3 pt |
| Digital Marketing — revenue (¥ million) | 16,670 | 12,521 | +33.1% |
| Digital Marketing — segment profit (¥ million) | 1,030 | 900 | +14.4% |
| Research & Insight — revenue (¥ million) | 16,534 | 16,376 | +1.0% |
| Research & Insight — segment profit (¥ million) | 3,067 | 3,823 | −19.8% |
| Unallocated corporate costs and eliminations (¥ million) | −2,307 | −2,200 | loss widened |
| Goodwill amortisation (¥ million) | 314 | 257 | +21.9% |
| Total assets (¥ million) | 26,707 | 16,421 | +62.6% |
| Net assets (¥ million) | 8,366 | 7,987 | +4.7% |
| Equity ratio | 31.3% | 48.6% | −17.3 pt |
| Operating cash flow (¥ million) | 1,854 | 1,956 | −5.2% |
| Cash and equivalents at year-end (¥ million) | 11,478 | 7,634 | +50.4% |
| FY6/2027 guidance — revenue (¥ million) | 40,000 | — | +20.5% |
| FY6/2027 guidance — operating profit (¥ million) | 2,500 | — | +39.7% |
| FY6/2027 guidance — ordinary profit (¥ million) | 2,500 | — | +38.2% |
| FY6/2027 guidance — net profit (¥ million) | 1,300 | — | +63.4% |
| FY6/2027 guidance — EPS (¥) | 67.30 | — | +63.4% |
| Annual dividend per share (¥) | 16.00 | 15.00 | +6.7% |
JapanStockPulse provides informational content only and does not constitute investment advice. Figures are taken from the company's published earnings short report and may be subject to subsequent revision.