The demand that carried last year's half has run out
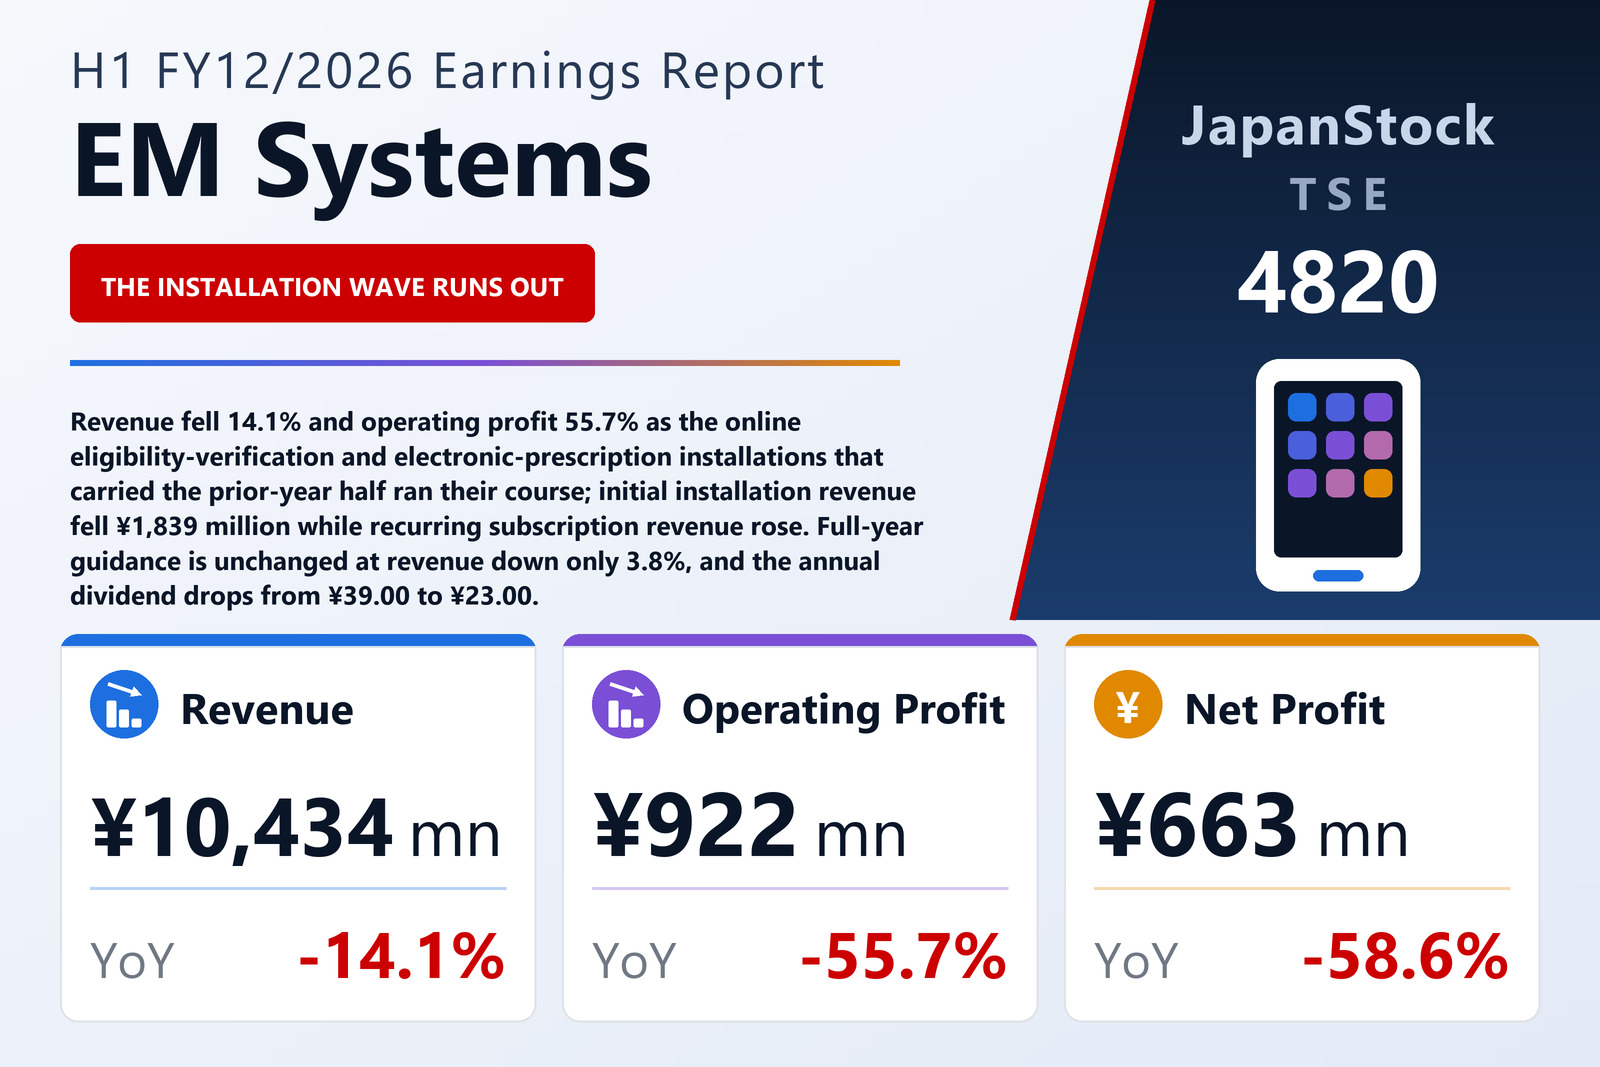
EM Systems Co., Ltd. (TSE: 4820), the Japanese supplier of the systems that dispensing pharmacies, medical clinics and nursing-care providers run their claims and records on — the MAPs for CLINIC and MAPs for NURSING CARE lines among them — published consolidated first-half results for the six months to June 30, 2026 on August 10, 2026 under Japanese GAAP. Revenue fell 14.1% to ¥10,434 million, operating profit 55.7% to ¥922 million, ordinary profit 46.7% to ¥1,279 million and profit attributable to owners of the parent 58.6% to ¥663 million, for earnings per share of ¥9.58 against ¥23.18. Comprehensive income was ¥1,054 million, down 34.2%. A half-year tanshin is not subject to an audit review.
The company is explicit about the cause, and it is not a demand problem in the underlying market — it describes healthcare digitisation in Japan as accelerating under the national "Medical DX Reiwa Vision 2030" programme. What has changed is the installation cycle. Adoption of the online eligibility-verification system and of electronic prescriptions, the two programmes that drove revenue in prior years, has run its course, and the concentrated demand of the prior-year half did not repeat. On top of that reaction, EM Systems says it deliberately redirected sales resources away from promoting replacement systems at existing customers and toward winning customers from competitors and selling higher-value services. From May it built a cross-company specialist team in the dispensing segment, which won installations of ministry-related optional software and recovered part of the shortfall — but not enough to keep revenue or operating profit at the prior-year level.
Every yen of the decline sits in upfront installation revenue
The revenue breakdown in the segment note makes the shape of the half unusually clear. Initial installation revenue fell from ¥5,971 million to ¥4,132 million, a drop of ¥1,839 million — larger than the ¥1,715 million by which group revenue fell. Recurring subscription revenue went the other way, rising from ¥4,160 million to ¥4,449 million. Supply revenue was near flat at ¥1,042 million against ¥1,063 million, maintenance revenue fell from ¥442 million to ¥339 million and other-business revenue from ¥512 million to ¥470 million. Within initial revenue the dispensing segment alone accounts for ¥1,562 million of the fall, from ¥4,961 million to ¥3,399 million. The recurring line is the one that survives a cycle; on these numbers it grew through the worst of one.
The operating-profit fall is a gross-profit fall. Gross profit dropped from ¥6,200 million to ¥5,011 million, 19.2%, against a 14.1% revenue decline, so the gross margin narrowed from 51.0% to 48.0%. SG&A expenses barely moved, ¥4,089 million against ¥4,119 million — a reduction of ¥30 million set against ¥1,189 million of lost gross profit. That is the whole of the ¥1,158 million operating-profit decline, and it leaves the operating margin at 8.8% against 17.1% a year earlier. Nothing in the cost base absorbed the revenue loss, which is what a fixed-cost software business looks like when installation volume drops.
Two of the four segments are now loss-making
Dispensing Pharmacy Systems, at ¥8,339 million of the ¥10,514 million segment total the business the group rests on, fell 15.6% and its profit 39.9% to ¥1,276 million. Medical Clinic Systems fell 18.2% to ¥1,225 million and swung to an operating loss of ¥254 million from ¥80 million of profit, as the prior year's concentrated electronic-prescription demand did not repeat and the segment prioritised winning new customers over replacements; the company notes that billed customer numbers for MAPs for CLINIC are rising steadily and that subscription revenue there is progressing. Nursing Care and Welfare Systems is the one grower, revenue up 56.6% to ¥411 million on migration to MAPs for NURSING CARE, a revised fee structure and the consolidation of Conduct Co., Ltd. (株式会社コンダクト), newly acquired during the half; its loss narrowed to ¥130 million from ¥169 million as chain-operator orders came in. Other fell 5.8% to ¥538 million with profit down 51.1% to ¥11 million, on resource optimisation at Unike Software Research (株式会社ユニケソフトウェアリサーチ) and one-off costs at Choki Co., Ltd. (チョキ株式会社). All four figures are stated before elimination of inter-segment transactions; a −¥79 million revenue adjustment and a +¥19 million profit adjustment reconcile the segment totals to the ¥10,434 million and ¥922 million reported.
Rental income is what separates ordinary profit from operating profit
Ordinary profit of ¥1,279 million sits ¥357 million above operating profit, and almost all of that gap is property. Non-operating income of ¥592 million is ¥558 million of real-estate rental income against ¥536 million a year earlier, plus ¥14 million of interest; non-operating expenses of ¥235 million are ¥227 million of costs on that same rental property. Ordinary profit therefore fell 46.7% where operating profit fell 55.7% — the rental stream is stable and the operating business is not. Below the line, extraordinary losses of ¥193 million include an impairment charge of ¥187 million, ¥82 million of it in Medical Clinic Systems and ¥104 million in Nursing Care and Welfare Systems, against ¥99 million of impairment a year earlier in the same two segments. Tax of ¥424 million left ¥663 million attributable to owners of the parent.
A shrinking balance sheet, and a dividend cut the filing does not explain
Total assets fell ¥730 million to ¥26,776 million. Current assets fell ¥1,155 million to ¥11,792 million, mainly a ¥1,263 million reduction in cash and deposits, while non-current assets rose ¥425 million to ¥14,983 million on ¥272 million more goodwill and ¥492 million more investment securities. The Conduct acquisition generated ¥409 million of goodwill, stated as provisional because the purchase-price allocation is not complete. Liabilities fell ¥294 million to ¥6,779 million and net assets ¥435 million to ¥19,996 million — retained earnings fell ¥859 million while the valuation difference on available-for-sale securities rose ¥344 million — so the equity ratio rose to 74.3% from 73.9% even as equity itself shrank, the arithmetic of a balance sheet contracting on the liability side faster than on the asset side. Net assets per share were ¥287.31 against ¥293.77.
Full-year guidance is unchanged from the February 13, 2026 forecast: revenue of ¥22,762 million (−3.8%), operating profit of ¥3,316 million (−9.8%), ordinary profit of ¥3,939 million (−8.7%) and attributable profit of ¥2,193 million (−10.6%), for earnings per share of ¥31.69. Subtracting the half just reported leaves an implied second half of ¥12,328 million of revenue and ¥2,394 million of operating profit — 2.6 times the ¥922 million just earned, from 18% more revenue. The filing does not set out how that step-up is to be achieved beyond the recovery work already described, and it is the single number a reader should weigh against the guide being left alone. The annual dividend falls to ¥23.00 from ¥39.00, a cut of ¥16.00 or 41.0%: ¥5.00 was set for the interim, with payment starting September 3, 2026, against ¥17.00 a year earlier, and ¥18.00 is forecast for the year-end against ¥22.00. That dividend forecast is marked unrevised, and the filing gives no reason for the reduction — it states no payout policy and records no commemorative or special component in the prior year's ¥39.00.
| Metric | H1 FY12/2026 | H1 FY12/2025 | Change |
|---|---|---|---|
| Revenue (¥ million) | 10,434 | 12,149 | −14.1% |
| Gross profit (¥ million) | 5,011 | 6,200 | −19.2% |
| Gross margin | 48.0% | 51.0% | −3.0 pt |
| SG&A expenses (¥ million) | 4,089 | 4,119 | −0.7% |
| Operating profit (¥ million) | 922 | 2,080 | −55.7% |
| Operating margin | 8.8% | 17.1% | −8.3 pt |
| Ordinary profit (¥ million) | 1,279 | 2,400 | −46.7% |
| Net profit attrib. to owners of parent (¥ million) | 663 | 1,603 | −58.6% |
| Comprehensive income (¥ million) | 1,054 | 1,601 | −34.2% |
| EPS (¥) | 9.58 | 23.18 | −58.7% |
| Dispensing Pharmacy Systems — revenue (¥ million) | 8,339 | 9,885 | −15.6% |
| Dispensing Pharmacy Systems — segment profit (¥ million) | 1,276 | 2,124 | −39.9% |
| Medical Clinic Systems — revenue (¥ million) | 1,225 | 1,497 | −18.2% |
| Medical Clinic Systems — segment profit (¥ million) | −254 | 80 | profit to loss |
| Nursing Care and Welfare Systems — revenue (¥ million) | 411 | 262 | +56.6% |
| Nursing Care and Welfare Systems — segment profit (¥ million) | −130 | −169 | loss narrowed |
| Other — revenue (¥ million) | 538 | 571 | −5.8% |
| Other — segment profit (¥ million) | 11 | 23 | −51.1% |
| Total assets (¥ million) | 26,776 | 27,506 | −2.7% |
| Net assets (¥ million) | 19,996 | 20,432 | −2.1% |
| Equity attrib. to owners of parent (¥ million) | 19,901 | 20,334 | −2.1% |
| Equity ratio | 74.3% | 73.9% | +0.4 pt |
| Net assets per share (¥) | 287.31 | 293.77 | −2.2% |
| FY12/2026 guidance — revenue (¥ million) | 22,762 | — | −3.8% |
| FY12/2026 guidance — operating profit (¥ million) | 3,316 | — | −9.8% |
| FY12/2026 guidance — ordinary profit (¥ million) | 3,939 | — | −8.7% |
| FY12/2026 guidance — net profit (¥ million) | 2,193 | — | −10.6% |
| FY12/2026 guidance — EPS (¥) | 31.69 | — | n.m. |
| Annual dividend per share (¥) | 23.00 | 39.00 | −41.0% |
JapanStockPulse provides informational content only and does not constitute investment advice. Figures are taken from the company's published earnings short report and may be subject to subsequent revision.