Copper, gold and a weaker yen tripled pre-tax profit
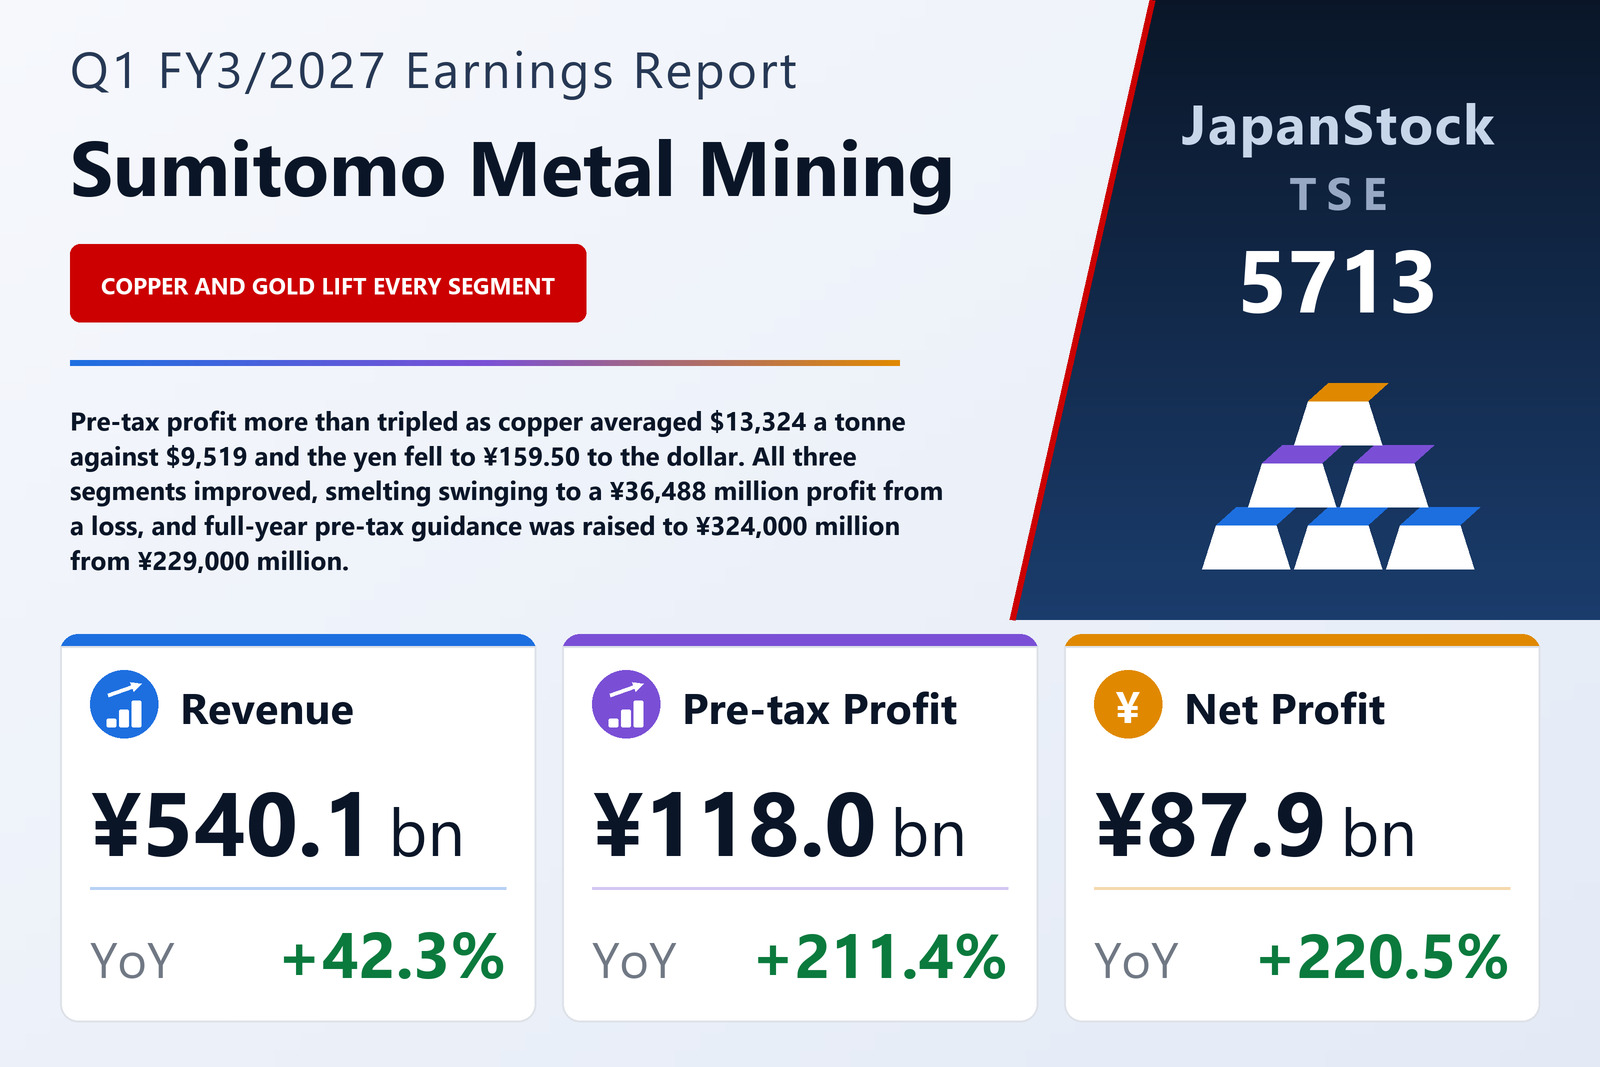
Sumitomo Metal Mining Co., Ltd. (TSE: 5713), the Tokyo-based non-ferrous group that mines copper, nickel and gold, smelts and refines them, and converts them into battery and electronic materials, published consolidated results for the three months to June 30, 2026 on August 10, 2026 under IFRS. Revenue rose 42.3% to ¥540,110 million, an increase of ¥160,510 million; pre-tax profit rose 211.4% to ¥118,040 million, an increase of ¥80,139 million; profit for the quarter rose 217.8% to ¥94,743 million; and profit attributable to owners of the parent rose 220.5% to ¥87,935 million, for basic earnings per share of ¥326.62 against ¥100.27. Total comprehensive income was ¥130,550 million against a negative ¥40,052 million a year earlier, on after-tax other comprehensive income of ¥35,807 million against −¥69,864 million; the two largest moves inside it were the foreign-currency translation reserve, from −¥55,055 million to ¥23,833 million, and equity-method associates' other comprehensive income, from −¥24,788 million to ¥6,507 million.
The company's own explanation is price and currency rather than volume. Copper averaged $13,324 a tonne against $9,519, nickel $8.24 a pound against $6.88 and gold $4,516.4 a troy ounce against $3,280.3, while the average telegraphic-transfer middle rate was ¥159.50 to the dollar against ¥144.60. Copper rose on a shortage of concentrate as mines were slow to recover from production trouble, together with data-centre infrastructure demand; nickel rose on Indonesian ore-quota cuts and on output cuts caused by a spike in the price of sulphur, a key ancillary material; gold slipped from the end of the previous fiscal year on expectations of U.S. rate rises but still averaged above a year earlier. Gross profit rose from ¥35,027 million to ¥109,634 million — an extra ¥74,607 million — while selling, general and administrative expenses moved only from ¥18,878 million to ¥19,693 million, so almost the whole of that gain reached the pre-tax line. Dividing each figure by its own revenue, the gross margin went from 9.2% to 20.3%.
Below gross profit the same forces appear again. Share of profit of equity-method investees nearly doubled, to ¥17,174 million from ¥8,625 million. That is the line where the group's minority interests in overseas copper mines report, and the company attributes the improvement directly to higher non-ferrous prices. Finance income rose to ¥17,386 million from ¥14,701 million and finance costs fell to ¥4,876 million from ¥6,396 million, while other income fell to ¥2,437 million from ¥6,462 million and other expenses rose to ¥4,022 million from ¥1,640 million. Tax expense rose to ¥23,297 million from ¥8,089 million; measured against each year's own pre-tax profit that is an effective rate of 19.7% against 21.3%.
Mineral Resources: the price did the work, the volumes did not
Mineral Resources lifted revenue 58.8% to ¥91,568 million and segment profit — which this company measures on a pre-tax basis rather than an operating one — 98.7% to ¥71,275 million. On the segment table's own figures that is 61.0% of the ¥116,933 million the three segments earned before corporate items, on 15.4% of their combined ¥595,504 million of revenue. The company credits higher copper and gold prices together with stable operation at the Quebrada Blanca copper mine in Chile and the Côté gold mine in Canada. Hishikari, the group's own Japanese gold mine, stayed on course for annual gold sales of 3.5 tonnes and sold 1.1 tonnes in the quarter. Among the equity-held overseas mines, Morenci in the United States produced 73 thousand tonnes of copper, above a year earlier, on a 25.0% interest excluding non-controlling interests; Cerro Verde in Peru produced 95 thousand tonnes, level with a year earlier, on 16.8%; Quebrada Blanca produced 54 thousand tonnes, above a year earlier, on 25.0%; and Côté produced 2.3 tonnes of gold, level with a year earlier, on 30.0%. One caveat on the comparison: from this quarter the company changed how it allocates unallocated general administrative expenses between segments, and the year-earlier segment figures shown here have been restated onto the new basis.
Smelting swung ¥40,264 million while every product line shrank
Smelting and Refining is the revenue engine — ¥414,317 million, up 44.1%, or 69.6% of the three segments' combined revenue — and it swung from a segment loss of ¥3,776 million to a profit of ¥36,488 million. That ¥40,264 million move is the single largest contributor to the group's ¥80,139 million increase in pre-tax profit, and it is not a volume story. The company attributes the swing to the weaker yen and to an improvement in inventory valuation gains and losses as metal prices rose, and its own parent-company output fell on every line: electrolytic copper from 109,383 tonnes to 106,560, gold from 3,227 kilograms to 2,621, electrolytic nickel from 16,469 tonnes to 15,113 and ferronickel from 1,292 tonnes to 1,047. Electrolytic copper sales fell along with production, while nickel and ferronickel sales rose despite it; production of mixed nickel-cobalt sulphide in the Philippines was level with a year earlier. A profit earned on inventory revaluation is worth less than one earned on throughput, and it reverses if prices do.
Materials is the smallest segment and the fastest-growing profit
Materials — battery materials such as nickel hydroxide and lithium nickelate, powder materials, device materials and catalysts — grew revenue 28.9% to ¥89,619 million and segment profit 263.9% to ¥9,170 million from ¥2,520 million, the fastest profit growth of the three. The company says battery-material sales held firm and that materials for electronic components sold well overall, led by powder and device materials for AI data centres. It is candid that electric and hybrid vehicle demand differs by country and region and that the outlook there remains unclear. At 15.0% of the three segments' combined revenue and 7.8% of their combined profit, Materials is still too small to move the group on its own — but it is the only one of the three whose result does not turn on the copper price.
Guidance revised upward, and by more than the quarter alone
Full-year guidance was revised with this filing. The company now expects revenue of ¥2,065,000 million (+18.6%), pre-tax profit of ¥324,000 million (+26.7%), profit for the year of ¥237,000 million (+25.6%) and profit attributable to owners of the parent of ¥216,000 million (+22.5%), for basic earnings per share of ¥803.95. Against the forecast published on May 11, 2026, that is revenue up from ¥1,883,000 million and pre-tax profit up from ¥229,000 million — an increase of ¥95,000 million, or 41.5% on the earlier number. The revision runs across all three segments: Mineral Resources' segment-profit guidance goes from ¥196,000 million to ¥256,000 million, Smelting's from ¥24,000 million to ¥63,000 million and Materials' from ¥4,000 million to ¥18,000 million, while the adjustment line moves the other way, from a positive ¥9,000 million to a negative ¥10,000 million. Revenue guidance rises from ¥334,000 million to ¥367,000 million in Mineral Resources, from ¥1,387,000 million to ¥1,516,000 million in Smelting and from ¥305,000 million to ¥356,000 million in Materials.
The assumptions behind the upgrade are more cautious than the quarter that produced it. For the second through fourth quarters the company assumes copper at $12,500 a tonne, nickel at $7.50 a pound, gold at $4,100.0 a troy ounce and the yen at ¥160.00 to the dollar, giving full-year averages of $12,706, $7.68, $4,204.1 and ¥159.87. Every metal assumption sits below the first quarter's realised average — copper $12,706 against $13,324, nickel $7.68 against $8.24, gold $4,204.1 against $4,516.4 — and only the exchange rate is assumed marginally weaker than the ¥159.50 realised. The company expects the full-year copper balance to remain in surplus as Indonesian mines recover, and expects nickel's oversupply to ease on Indonesian quota limits and on difficulty procuring sulphur. On those assumptions the first quarter's ¥118,040 million already accounts for 36.4% of the ¥324,000 million guided for the year.
A balance sheet that barely moved, and a buyback that did
Total assets rose ¥68,228 million to ¥3,627,234 million on higher cash, accrued interest within other current financial assets, equity-method investments and property, plant and equipment. Liabilities rose only ¥4,396 million to ¥1,271,404 million: bonds and borrowings rose in both the current and non-current sections, while trade and other payables fell from ¥308,491 million to ¥273,962 million and income taxes payable from ¥34,180 million to ¥21,932 million. Equity rose ¥63,832 million to ¥2,355,830 million despite the buyback, on the quarter's profit and on the translation reserve, and the ratio of equity attributable to owners of the parent rose to 58.7% from 58.3% — more than half the funding is equity, which is what lets a company this exposed to metal prices carry the swing described above. Operating cash flow turned from an outflow of ¥617 million to an inflow of ¥62,972 million even though income tax paid rose to ¥36,341 million from ¥21,139 million, helped by dividends received of ¥20,543 million against ¥14,620 million. The investing outflow narrowed to ¥19,439 million from ¥25,462 million as ¥8,168 million of investment securities were sold, and financing turned to an outflow of ¥21,307 million from an inflow of ¥11,659 million. Cash and equivalents closed at ¥141,343 million, ¥189 million above a year earlier.
Shareholder returns are the one place the upgrade does not show. The dividend forecast is unrevised at ¥207.00 for the year — an interim ¥103.00 and a year-end ¥104.00 — against the ¥228.00 actually paid for FY3/2026, which was ¥65.00 at the interim and ¥163.00 at the year-end. The company paid out ¥44,100 million of dividends during the quarter against ¥15,126 million a year earlier. The buyback is where the capital went: the board resolved on May 11, 2026 to acquire and cancel treasury shares, and ¥20,007 million was spent in the quarter, taking treasury holdings from 20,264,282 shares to 22,326,154 while shares issued stayed at 290,814,015. The average share count fell to 269,224,512 from 273,637,413, which is why basic earnings per share rose 225.7% while profit attributable to owners of the parent rose 220.5% — and the guidance figure of ¥803.95 already reflects the acquisition and cancellation.
| Metric | Q1 FY3/2027 | Q1 FY3/2026 | Change |
|---|---|---|---|
| Revenue (¥ million) | 540,110 | 379,600 | +42.3% |
| Gross profit (¥ million) | 109,634 | 35,027 | +213.0% |
| SG&A expenses (¥ million) | 19,693 | 18,878 | +4.3% |
| Share of profit of equity-method investees (¥ million) | 17,174 | 8,625 | +99.1% |
| Pre-tax profit (¥ million) | 118,040 | 37,901 | +211.4% |
| Net profit (¥ million) | 94,743 | 29,812 | +217.8% |
| Net profit attrib. to owners of parent (¥ million) | 87,935 | 27,438 | +220.5% |
| Comprehensive income (¥ million) | 130,550 | −40,052 | loss to profit |
| EPS (¥) | 326.62 | 100.27 | +225.7% |
| Mineral Resources — revenue (¥ million) | 91,568 | 57,679 | +58.8% |
| Mineral Resources — segment profit (¥ million) | 71,275 | 35,869 | +98.7% |
| Smelting and Refining — revenue (¥ million) | 414,317 | 287,422 | +44.1% |
| Smelting and Refining — segment profit (¥ million) | 36,488 | −3,776 | loss to profit |
| Materials — revenue (¥ million) | 89,619 | 69,522 | +28.9% |
| Materials — segment profit (¥ million) | 9,170 | 2,520 | +263.9% |
| Total assets (¥ million) | 3,627,234 | 3,559,006 | +1.9% |
| Net assets (¥ million) | 2,355,830 | 2,291,998 | +2.8% |
| Equity attrib. to owners of parent (¥ million) | 2,129,916 | 2,074,835 | +2.7% |
| Equity ratio | 58.7% | 58.3% | +0.4 pt |
| FY3/2027 guidance — revenue (¥ million) | 2,065,000 | — | +18.6% |
| FY3/2027 guidance — pre-tax profit (¥ million) | 324,000 | — | +26.7% |
| FY3/2027 guidance — net profit (¥ million) | 237,000 | — | +25.6% |
| FY3/2027 guidance — net profit attrib. to owners of parent (¥ million) | 216,000 | — | +22.5% |
| FY3/2027 guidance — EPS (¥) | 803.95 | — | n.m. |
| Annual dividend per share (¥) | 207.00 | 228.00 | −9.2% |
JapanStockPulse provides informational content only and does not constitute investment advice. Figures are taken from the company's published earnings short report and may be subject to subsequent revision.