All three businesses improved, and the life insurer accounts for most of the swing
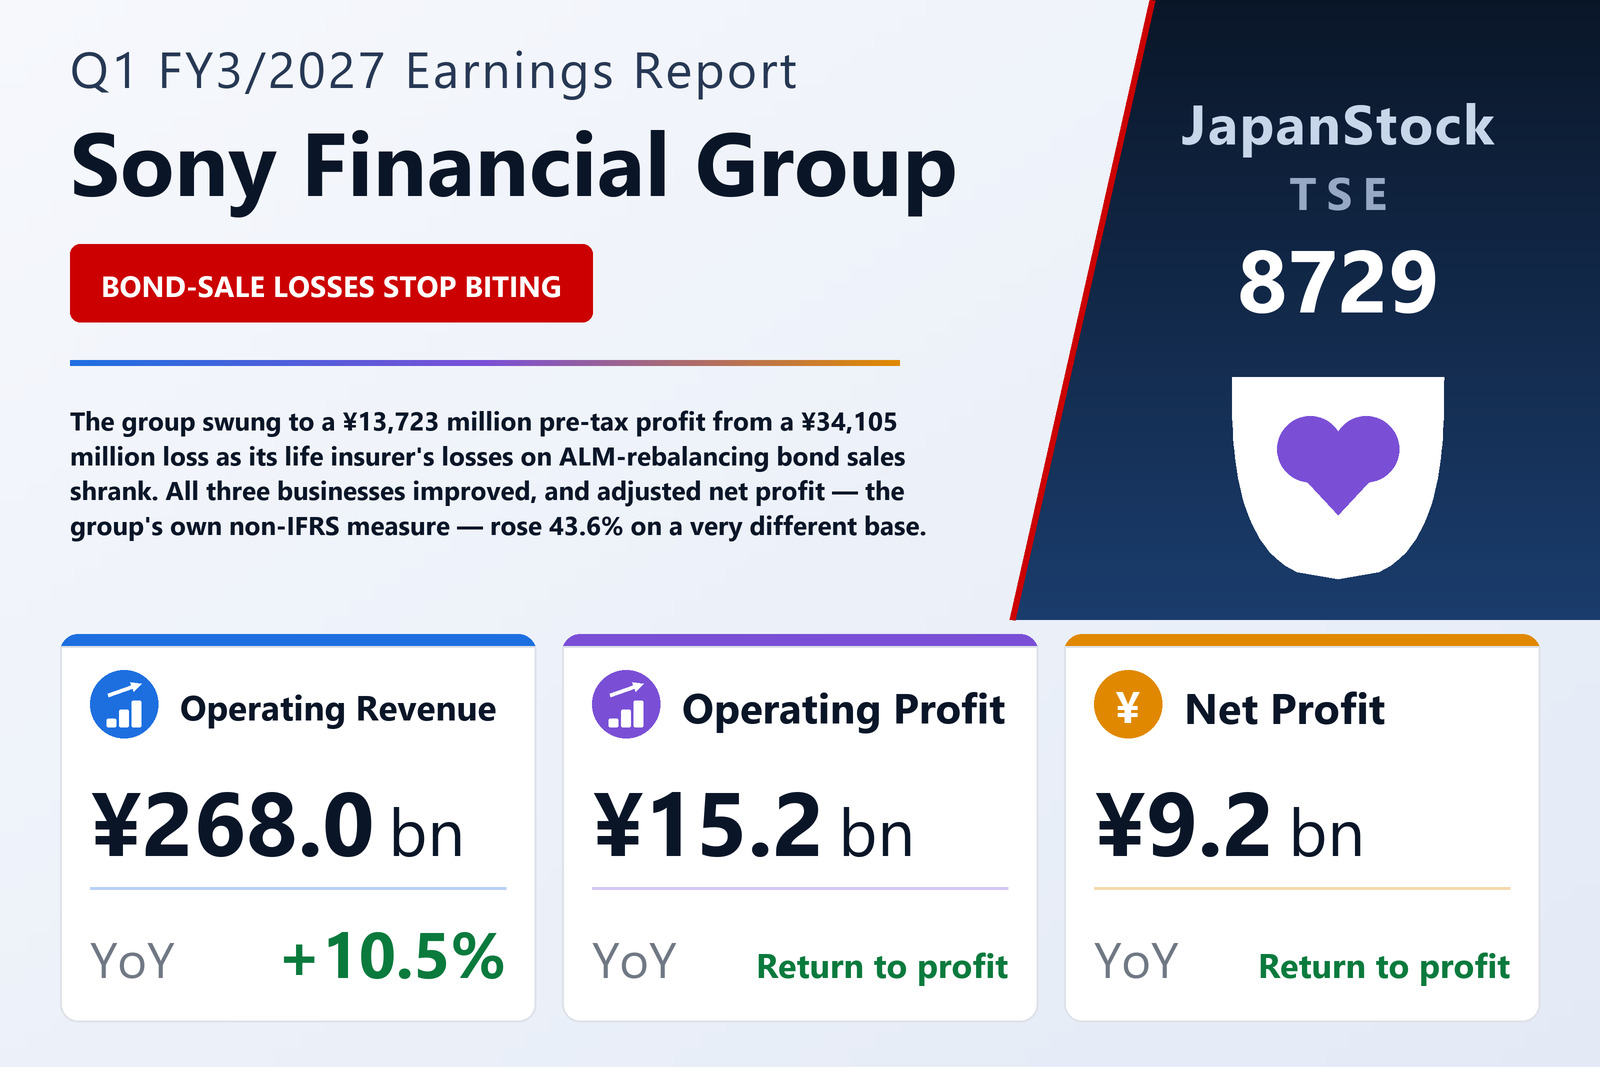
Sony Financial Group Inc. (TSE: 8729), the Tokyo-listed holding company whose reportable segments are life insurance, non-life insurance and banking, published consolidated results for the three months to June 30, 2026 on August 10, 2026. Operating revenue rose 10.5% to ¥268,033 million. Operating profit was ¥15,228 million against a ¥33,552 million loss a year earlier, pre-tax profit ¥13,723 million against a ¥34,105 million loss, and profit attributable to owners of the parent ¥9,160 million against a ¥24,492 million loss, for basic and diluted earnings per share of ¥1.37 against −¥3.43. Those per-share figures look small for a group of this size because the company split its shares on August 8, 2025, 435,100,266 shares becoming 7,149,358,214, and both periods are stated as though that split had occurred at the start of the prior fiscal year; the weighted average share count this quarter was 6,708,446,322.
This is also the group's first quarter reported under IFRS. The filing states that the group has voluntarily adopted IFRS in place of Japanese GAAP from the first quarter of FY3/2027, that its IFRS transition date was April 1, 2024, and that it early-adopted IFRS 18 in the previous fiscal year — which is why operating profit appears as a defined subtotal at all. The prior-year comparatives are IFRS as well, and because this is not a first-time adoption under IFRS 1, no reconciliation from Japanese GAAP is provided.
Pre-tax profit is broken out by business. Life insurance earned ¥1,642 million against a ¥41,192 million loss; the filing puts that improvement at ¥42.8 billion, against ¥47.8 billion for the group, so the life book is very nearly the whole story. Non-life insurance earned ¥6,898 million, up 42.0%, on revenue growth plus control of operating expenses. Banking earned ¥6,002 million, up 117.0%, on higher net interest income despite an increase in advertising and other operating expenses. Segment revenue — defined in the filing as insurance revenue plus fee income, interest income and other operating revenue, and shown here including intersegment transactions — was ¥182,443 million at life, ¥49,145 million at non-life and ¥32,978 million at banking, with ¥4,426 million in an Other line covering nursing care and venture capital and ¥907 million of holding-company cost left unallocated.
The swing is a smaller loss on bond sales, not better underwriting
The life insurer's improvement has a stated cause, and it is not underwriting. The company says the segment's pre-tax result improved because losses on securities sales in the general account fell — sales of bonds made to rebalance the portfolio on asset-liability management principles — partly offset by a deterioration in market-driven results on the minimum guarantees attached to variable insurance. The scale of that shift sits in the group's own reconciliation table, where the add-back for securities-sale losses at the life subsidiary was ¥102,139 million before tax a year ago and ¥36,216 million this quarter. That is a reduction of ¥65,923 million in an item the company itself treats as outside its recurring earning power, inside a group swing the filing puts at ¥47.8 billion.
Underneath that, the operating businesses did grow. Insurance revenue rose 9.4% to ¥178,005 million — ¥129,648 million from life and ¥48,357 million from non-life — and net interest income rose 22.2% to ¥58,941 million, interest income of ¥78,607 million against interest expense of ¥19,666 million. Selling, general and administrative expenses rose 10.5% to ¥29,227 million, matching the top line's growth rate exactly. Net fee income stayed negative, at −¥1,316 million against −¥1,234 million, fees paid still exceeding fees received.
Two lines of roughly ¥700 billion each that almost cancel
The largest numbers in the income statement never reach the bottom line. The investment result swung to a gain of ¥672,198 million from a ¥32,019 million loss, while insurance finance income and expenses swung the other way, to a net charge of ¥750,701 million from ¥76,208 million. These are two sides of the same book — the assets backing variable insurance and variable annuities, and the liabilities those assets support. The reconciliation table sizes the pair at −¥704,301 million inside the investment result and +¥699,866 million inside insurance finance, which is why movements of that magnitude leave a pre-tax profit of only ¥13,723 million. The total financial result netted out at −¥10,774 million, against −¥59,894 million a year earlier.
Between operating profit and pre-tax profit sit the share of equity-method results at −¥796 million and financing costs of ¥707 million, which together account for the ¥1,505 million distance between the ¥15,228 million operating figure and the ¥13,723 million pre-tax one. Tax was a charge of ¥4,563 million this quarter against a ¥9,613 million credit a year earlier — the mechanical consequence of moving from a loss to a profit, and a reminder that the year-earlier attributable loss of ¥24,492 million was already net of that credit.
Adjusted net profit is a different measure, and its definition changed this quarter
Adjusted net profit rose 43.6% to ¥31,503 million from ¥21,943 million. It is not an IFRS figure. The group defines it as IFRS net profit adjusted for gains and losses caused by market movements and by one-off factors, arguing that this better represents sustainable earning power, and the filing says plainly that it is not a subtotal defined by IFRS and may not be comparable with similar measures other companies publish. The adjustments totalled ¥32,325 million before tax and ¥22,343 million after tax this quarter, against ¥65,634 million and ¥46,436 million a year earlier. That gap is why the two measures tell different stories: the IFRS figure swung from a loss to a profit, while the adjusted figure was already comfortably profitable a year ago and grew from a much higher base.
The definition itself moved this quarter. The group has added valuation differences on the life subsidiary's ALM hedging transactions, excluding hedge costs, to the list of adjustment items, on the stated reasoning that the expanding hedge book makes the accounting mismatch increasingly material to IFRS profit. That item was small in both periods — ¥543 million before tax this quarter and ¥2,226 million in the restated comparative — but the point is that the boundary of the measure is set by management and has just been widened. Neither period carried any one-off items at group companies. The filing does not print the formula itself; it refers readers to a separate presentation published on the company's website the same day.
A ¥21.8 trillion balance sheet carried on 4.0% equity
Total assets rose 4.9% to ¥21,787,284 million from March 31, 2026. Securities of ¥15,923,692 million — roughly 73% of the balance sheet — rose 4.9%, while loans fell 0.7% to ¥3,671,262 million. Liabilities rose 5.3% to ¥20,911,085 million, with insurance contract liabilities up 5.5% to ¥13,450,597 million and banking deposits up 0.4% to ¥4,620,117 million. Total equity fell 3.5% to ¥876,199 million, of which all but ¥24 million is attributable to owners of the parent, and the ratio of parent equity to total assets fell from 4.4% to 4.0%. That is a thin cushion, and it thinned in a quarter the group finished in profit.
Equity fell for two reasons the income statement does not show. Other comprehensive income was negative ¥15,120 million: debt instruments measured at fair value through other comprehensive income lost ¥106,681 million as the bond book was marked, while insurance finance income and expenses recognised in equity added ¥93,201 million back, the liabilities moving with the same rates that moved the assets. Total comprehensive income was therefore negative ¥5,959 million against positive ¥28,987 million a year earlier — a quarter that earned an IFRS profit and still destroyed comprehensive income. The second reason is the ¥25,609 million of dividends paid during the quarter, which is why retained earnings fell from ¥2,261,857 million to ¥2,245,334 million despite the profit. Accumulated other comprehensive income stands at −¥1,516,191 million.
Guidance revised without an explanation, and a US trust company for digital assets
Full-year FY3/2027 guidance is operating revenue of ¥1,070,000 million (+5.2%), operating profit of ¥29,000 million, pre-tax profit of ¥37,000 million, profit attributable to owners of the parent of ¥23,000 million and adjusted net profit of ¥110,000 million (+2.4%). The tanshin marks this forecast as revised from the one most recently announced — and then gives no revision table, no before-and-after figures and no explanation of what changed, which is the single thing a reader most needs from this filing. Note too that the guidance table carries a year-on-year percentage only for operating revenue and adjusted net profit; the operating, pre-tax and attributable lines show a dash. The dividend forecast is unchanged at ¥8.00 for the year, ¥4.00 at the interim and ¥4.00 at year-end, against ¥3.80 paid for FY3/2026 as a year-end payment only.
Two subsequent events are disclosed, and one of them is unusual for an insurance group. Sony Bank established a wholly owned US subsidiary, Connectia Trust, National Association, on July 10, 2026 with capital of US$40 million, to build a base for digital-asset-related business in the United States; because that capital exceeds a tenth of the parent's own, it qualifies as a specified subsidiary. Separately, Sony Bank has been served notice that a co-sale right under a shareholders agreement has been exercised over its equity-method associate B.X.J.A.1 Holding, which owns SP.LINKS and ETC Solutions. The transfer is expected during FY3/2027, subject to regulatory approvals, and the group expects to book approximately ¥11.0 billion of pre-tax profit on it. The filing does not connect that gain to the guidance revision, and a reader should not assume the link.
| Metric | Q1 FY3/2027 | Q1 FY3/2026 | Change |
|---|---|---|---|
| Operating revenue (¥ million) | 268,033 | 242,622 | +10.5% |
| Insurance revenue (¥ million) | 178,005 | 162,723 | +9.4% |
| Net interest income (¥ million) | 58,941 | 48,249 | +22.2% |
| SG&A expenses (¥ million) | 29,227 | 26,442 | +10.5% |
| Operating profit (¥ million) | 15,228 | −33,552 | loss to profit |
| Pre-tax profit (¥ million) | 13,723 | −34,105 | loss to profit |
| Net profit attrib. to owners of parent (¥ million) | 9,160 | −24,492 | loss to profit |
| Adjusted net profit (¥ million) | 31,503 | 21,943 | +43.6% |
| Comprehensive income (¥ million) | −5,959 | 28,987 | profit to loss |
| EPS (¥) | 1.37 | −3.43 | loss to profit |
| Life Insurance — revenue (¥ million) | 182,443 | 170,756 | +6.8% |
| Life Insurance — segment profit (¥ million) | 1,642 | −41,192 | loss to profit |
| Non-Life Insurance — revenue (¥ million) | 49,145 | 42,687 | +15.1% |
| Non-Life Insurance — segment profit (¥ million) | 6,898 | 4,859 | +42.0% |
| Banking — revenue (¥ million) | 32,978 | 25,730 | +28.2% |
| Banking — segment profit (¥ million) | 6,002 | 2,765 | +117.0% |
| Total assets (¥ million) | 21,787,284 | 20,775,505 | +4.9% |
| Securities (¥ million) | 15,923,692 | 15,184,147 | +4.9% |
| Insurance contract liabilities (¥ million) | 13,450,597 | 12,749,724 | +5.5% |
| Net assets (¥ million) | 876,199 | 907,675 | −3.5% |
| Equity ratio | 4.0% | 4.4% | −0.4 pt |
| FY3/2027 guidance — operating revenue (¥ million) | 1,070,000 | — | +5.2% |
| FY3/2027 guidance — operating profit (¥ million) | 29,000 | — | n.m. |
| FY3/2027 guidance — pre-tax profit (¥ million) | 37,000 | — | n.m. |
| FY3/2027 guidance — net profit (¥ million) | 23,000 | — | n.m. |
| FY3/2027 guidance — adjusted net profit (¥ million) | 110,000 | — | +2.4% |
| Annual dividend per share (¥) | 8.00 | 3.80 | +110.5% |
JapanStockPulse provides informational content only and does not constitute investment advice. Figures are taken from the company's published earnings short report and may be subject to subsequent revision.