Record first-quarter sales and operating profit, on a gross margin up 1.2 points
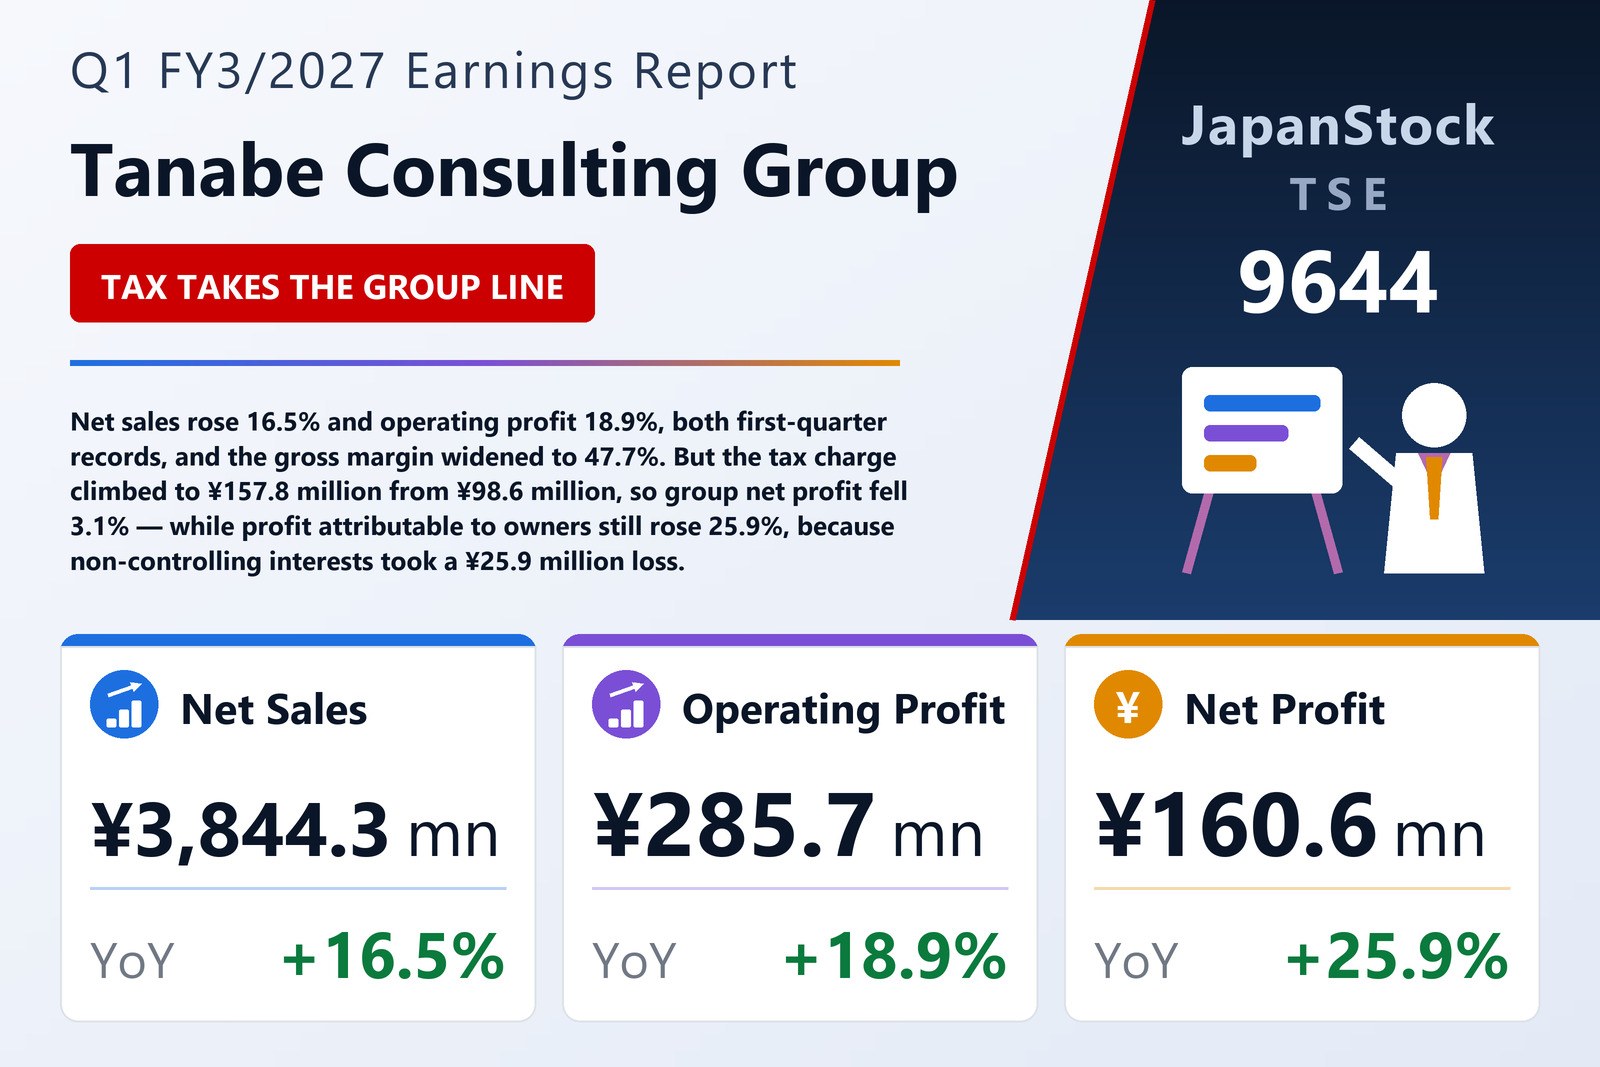
Tanabe Consulting Group Co., Ltd. (TSE: 9644), which sells strategy-through-implementation "team consulting" to Japan's mid-sized companies — the filing defines its target market as firms with sales between ¥3 billion and ¥1 trillion — published consolidated results for the three months to June 30, 2026 on August 10, 2026 under Japanese GAAP. Net sales rose 16.5% to ¥3,844 million and operating profit 18.9% to ¥285 million, both of which the company calls records for a first quarter. Ordinary profit rose 23.1% to ¥292 million and profit attributable to owners of the parent 25.9% to ¥160 million, for basic earnings per share of ¥5.00 against ¥3.91 and diluted earnings per share of ¥5.00 against ¥3.90. The comparison flatters the quarter in one respect: a year earlier operating profit had fallen 14.5% and attributable profit 33.7%, so this is a rebound off a weak base as much as it is a record.
Both margins moved the right way. Gross profit rose 19.5% to ¥1,833.7 million, faster than the 16.5% sales growth, lifting the gross margin from 46.5% to 47.7% — 1.2 percentage points, and the clearest evidence in the filing that the work is being priced better. Selling, general and administrative expenses then rose 19.6% to ¥1,548.0 million, almost exactly in step with gross profit, which is why the operating margin improved by only 0.2 points, to 7.4% from 7.3%. The company frames that spending as deliberate — it says it expanded human-capital investment to staff the consulting domains — and the quarter also carried heavier non-cash charges from earlier acquisitions: goodwill amortisation of ¥45.3 million against ¥28.3 million and depreciation of ¥53.3 million against ¥32.2 million.
The tax line, not the business, decided the group net figure
Below operating profit almost everything improved. Non-operating income rose to ¥9.9 million from ¥3.8 million, on interest income of ¥1.4 million against ¥0.08 million and dividend income of ¥4.1 million against none at all, while non-operating expenses fell to ¥3.1 million from ¥6.4 million as an investment-partnership loss shrank to ¥0.2 million from ¥3.5 million. After a ¥0.07 million loss on disposal of fixed assets, pre-tax profit rose 23.1% to ¥292.4 million. Then the tax charge rose to ¥157.8 million from ¥98.6 million. Dividing each charge by its own pre-tax profit — the arithmetic is ours, both pairs of figures are the filing's — gives an implied burden of 53.9% this year against 41.5% last. Tanabe computes quarterly tax by applying an estimated annual effective rate rather than a full computation, so that swing reflects a changed view of the whole year, not a one-quarter event.
That is why group net profit fell 3.1%, to ¥134.7 million from ¥139.0 million, on pre-tax profit that rose 23.1%. Profit attributable to owners of the parent nonetheless rose 25.9% to ¥160.6 million — more than the group earned in total — because non-controlling interests swung to a ¥25.9 million loss from an ¥11.5 million profit. Whatever is losing money inside this group is being lost largely by other people's shareholders, and the filing does not identify the subsidiary concerned. Comprehensive income fell 6.2% to ¥127.8 million, held back by a negative retirement-benefit adjustment of ¥7.2 million against ¥3.2 million a year earlier.
HR led the six domains, and two of the six are not what they were
The group reports a single reportable segment — management consulting — and therefore discloses no segment profit at all. What it does publish is a revenue analysis across six consulting domains, and all six grew. HR was fastest at +27.8%, to ¥824.2 million, on demand for human-capital management, pay-and-grade redesign, corporate academies, DE&I work and employee-assistance programmes; that also makes it the largest of the six. Strategy & Domain rose 17.6% to ¥800.5 million, helped by a newly created industry-specialist organisation and by public-sector work, Brand & PR 15.7% to ¥759.5 million and Digital & DX 13.4% to ¥642.4 million. The slowest of the five consulting domains was Finance & M&A, up 9.2% to ¥777.1 million; Other, which is the Blue Diary planner and promotional goods, added 1.4% to ¥40.6 million. Two of those lines have been redrawn, and the company says so under the table: creative-design work — brand consulting and web production — done by J-Three (株式会社ジェイスリー) has moved out of Digital & DX into Brand & PR, and the FP&A business carved out of the DX and ERP practice at Growin' Partners (グローウィン・パートナーズ株式会社) has moved out of Digital & DX into Finance & M&A. Prior-year figures were restated on the new basis, so the growth rates above are like-for-like — but the levels are not what an earlier filing showed, and Digital & DX has had two pieces taken out of it.
A smaller balance sheet, because distributions outran the quarter's profit
Total assets fell ¥317 million to ¥14,851 million. Current assets fell ¥290 million to ¥8,355 million as cash and deposits went to ¥6,298.9 million from ¥6,490.4 million and trade receivables and contract assets to ¥995.1 million from ¥1,178.6 million; non-current assets fell ¥26 million to ¥6,495 million, a higher retirement-benefit asset offset by goodwill amortising down to ¥1,479.2 million from ¥1,524.5 million. Liabilities rose ¥83 million to ¥3,880 million — income taxes payable dropped to ¥180.5 million from ¥353.3 million and the bonus provision to ¥92.6 million from ¥259.4 million, but advances received lifted other current liabilities, and long-term borrowings fell. Net assets fell ¥400 million to ¥10,971 million: the quarter's profit was recorded, but the dividend took more back out, and treasury stock rose to ¥1,105.1 million from ¥1,058.3 million after on-market buying. The equity ratio slipped to 68.6% from 69.6%, which on a balance sheet carrying this little debt is a rounding matter rather than a strain. No quarterly consolidated cash-flow statement was prepared.
Guidance untouched, and the seasonality that puts a record quarter under a lower half-year forecast
Neither the half-year nor the full-year forecast was changed from the numbers published with the FY3/2026 results on May 13, 2026. The full year is guided to net sales of ¥17,200 million (+5.6%), operating profit of ¥1,900 million (+4.7%), ordinary profit of ¥1,900 million (+3.1%) and profit attributable to owners of the parent of ¥1,155 million (+5.0%), for earnings per share of ¥35.97. The first half is guided to net sales of ¥8,100 million (+5.8%) but operating profit of ¥910 million, down 4.7%. A record first quarter therefore sits inside a half-year the company still expects to earn less than last year's.
The filing supplies the reason without connecting it to the forecast: PeaceMind (ピースマインド株式会社), the group's corporate-wellbeing business, sells stress checks and related services whose revenue concentrates in the third quarter, so the group's quarters are explicitly not comparable with one another. The shape of the year shows in the arithmetic: the ¥285.7 million of first-quarter operating profit is 15.0% of the ¥1,900 million full-year target, and the ¥910 million half-year target implies roughly ¥624 million in the second quarter alone. The dividend forecast is unchanged too, at ¥29.00 for the year — ¥13.00 interim and ¥16.00 final — against ¥27.00 paid for FY3/2026, with no first-quarter payment. Behind it sits the new five-year plan, TCG Future Vision 2030, under which the group targets return on equity of 15% by FY3/2031 and net sales of ¥25,000 million, ¥2,000–3,000 million of which is meant to come from acquisitions funded out of more than ¥3,000 million of cash on hand.
| Metric | Q1 FY3/2027 | Q1 FY3/2026 | Change |
|---|---|---|---|
| Net sales (¥ million) | 3,844.3 | 3,300.2 | +16.5% |
| Gross profit (¥ million) | 1,833.7 | 1,534.4 | +19.5% |
| Gross margin | 47.7% | 46.5% | +1.2 pt |
| SG&A expenses (¥ million) | 1,548.0 | 1,294.2 | +19.6% |
| Operating profit (¥ million) | 285.7 | 240.2 | +18.9% |
| Operating margin | 7.4% | 7.3% | +0.2 pt |
| Ordinary profit (¥ million) | 292.5 | 237.5 | +23.1% |
| Pre-tax profit (¥ million) | 292.4 | 237.5 | +23.1% |
| Net profit (¥ million) | 134.7 | 139.0 | −3.1% |
| Net profit attrib. to owners of parent (¥ million) | 160.6 | 127.5 | +25.9% |
| Comprehensive income (¥ million) | 127.8 | 136.2 | −6.2% |
| EPS (¥) | 5.00 | 3.91 | +27.9% |
| Strategy & Domain — revenue (¥ million) | 800.5 | 680.6 | +17.6% |
| Digital & DX — revenue (¥ million) | 642.4 | 566.5 | +13.4% |
| HR — revenue (¥ million) | 824.2 | 644.8 | +27.8% |
| Finance & M&A — revenue (¥ million) | 777.1 | 711.8 | +9.2% |
| Brand & PR — revenue (¥ million) | 759.5 | 656.5 | +15.7% |
| Other — revenue (¥ million) | 40.6 | 40.0 | +1.4% |
| Total assets (¥ million) | 14,851.8 | 15,169.0 | −2.1% |
| Net assets (¥ million) | 10,971.3 | 11,372.0 | −3.5% |
| Shareholders' equity (¥ million) | 10,181.3 | 10,556.6 | −3.6% |
| Equity ratio | 68.6% | 69.6% | −1.0 pt |
| FY3/2027 guidance — revenue (¥ million) | 17,200 | — | +5.6% |
| FY3/2027 guidance — operating profit (¥ million) | 1,900 | — | +4.7% |
| FY3/2027 guidance — ordinary profit (¥ million) | 1,900 | — | +3.1% |
| FY3/2027 guidance — net profit (¥ million) | 1,155 | — | +5.0% |
| FY3/2027 guidance — EPS (¥) | 35.97 | — | n.m. |
| Annual dividend per share (¥) | 29.00 | 27.00 | +7.4% |
JapanStockPulse provides informational content only and does not constitute investment advice. Figures are taken from the company's published earnings short report and may be subject to subsequent revision.