A store-marketing software company, not a marketplace
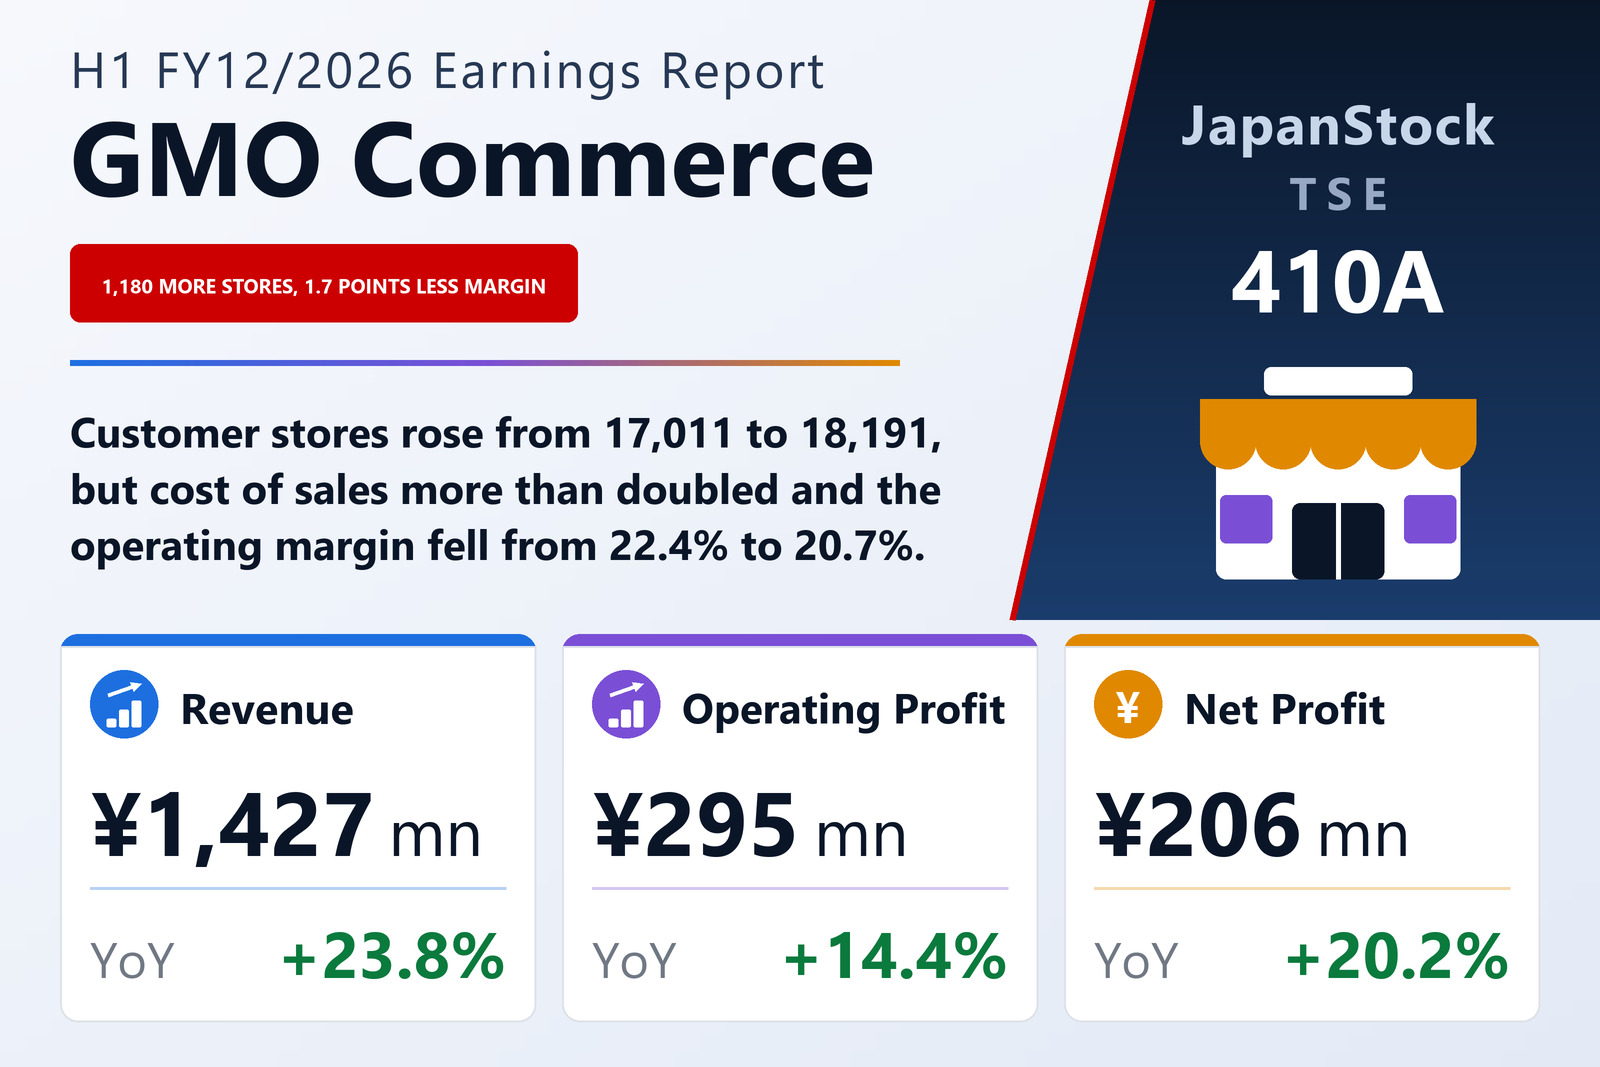
GMO Commerce, Inc. (TSE: 410A), a Tokyo-based member of the GMO Internet Group, published non-consolidated results for the six months to June 30, 2026 on August 13, 2026 under Japanese GAAP. Despite the name it operates no marketplace. Its single reportable business — the CX-improvement solutions business — sells marketing and customer-experience software to operators of physical stores in retail, restaurants and services: it collects and analyses a store's customer data, runs personalised marketing on the store's behalf, measures the result and proposes improvements, with a dedicated team providing hands-on operational support. The company states its mission as becoming the marketing platform for every store and manages the business to annual recurring revenue. Revenue rose 23.8% to ¥1,427 million, operating profit 14.4% to ¥295 million, ordinary profit 14.6% to ¥296 million and net profit 20.2% to ¥206 million, for earnings per share of ¥37.56 against ¥47.85.
The store count beat plan, and the price per store rose with it
Customer stores rose from 17,011 at December 31, 2025 to 18,191 at June 30, 2026, an increase of 1,180 that the company says ran ahead of its internal plan. It attributes the gain to both new wins and deeper penetration of existing accounts. On the new side, direct selling continued to grow on the strength of an AI-based proprietary data platform and the hands-on support team; large multi-store chains were won as major accounts; sales-partner tie-ups were expanded; and mutual customer referrals with the GMO Internet Group pushed the product further into the medical and beauty-salon verticals. On the existing side, customers added more stores within the same brand and took on additional products.
Average revenue per store rose from ¥12,035 at the end of the first quarter to ¥12,665 at the end of the second, which the company attributes to more active personalised delivery as per-store operating data accumulates, and to upselling of additional products. Monthly churn averaged about 1.3% across the half, which the company credits to the store-level support model. On those three inputs — more stores, a higher price per store, low attrition — annual recurring revenue reached a record high at the half-year end. The filing does not put a figure on the ARR itself, so the reader gets the direction without the level.
The growth was paid for below the revenue line
Revenue grew 23.8% and operating profit only 14.4%, and effectively all of the difference sits in cost of sales. Cost of sales rose 123.1%, from ¥173,745 thousand to ¥387,542 thousand, so gross profit grew only 6.2% to ¥1,040 million and the gross margin fell from 84.9% to 72.9% on the filing's own figures. Selling, general and administrative expenses rose just 3.3% to ¥744 million: of the ¥237 million increase in total operating cost, cost of sales accounts for roughly 90%. The operating margin therefore fell from 22.4% to 20.7%. The filing does not break out what drove the cost-of-sales increase, and it discloses no change of accounting policy, no change of estimate and no restatement — so this document does not let a reader tell whether the shift is delivery cost scaling with the store count or a change in where existing cost is booked.
Below the operating line the picture is quieter. Non-operating income of ¥2,776 thousand was mostly interest, and non-operating expenses of ¥1,567 thousand — none of which existed a year earlier — included ¥519 thousand of share-buyback costs, ¥1,000 thousand of donations, ¥30 thousand of interest paid and ¥18 thousand of share-issuance costs; ordinary profit rose 14.6% to ¥296 million. Net profit nonetheless grew faster than operating profit, at 20.2%, because tax of ¥89,731 thousand against ¥86,742 thousand on a larger pre-tax base means the effective rate fell from 33.5% to 30.3%.
Net assets fell even though the company earned ¥206 million
Net assets fell ¥132,374 thousand to ¥2,643 million, and the filing gives the two reasons. The company bought 113,200 treasury shares for ¥129,926 thousand, against no treasury stock at all at the prior year-end, and retained earnings fell ¥15,970 thousand because ¥222,826 thousand of dividends paid outweighed the ¥206,856 thousand of net profit added. Total assets rose ¥624,889 thousand to ¥4,663 million and liabilities ¥757,263 thousand to ¥2,019 million, because the company drew ¥700,000 thousand of new borrowings — it carried none at December 31, 2025 — which is also why cash and deposits rose ¥418,910 thousand. Assets up and equity down is why the equity ratio fell from 68.7% to 56.7%. Operating cash flow was ¥255 million against ¥143 million, the investing outflow ¥58 million mostly on intangible assets, and closing cash and equivalents ¥3,463 million.
Earnings per share fell 21.5% while net profit rose 20.2%, and that is a share-count effect rather than a deterioration. The weighted-average share count went from 3,596,400 to 5,507,469, up 53.1%, following the company's listing in September 2025. The 666-for-1 share split of April 11, 2025 is applied retroactively to the prior period in the filing's own note, so the split itself does not move this comparison — the new shares do. Diluted earnings per share were ¥37.15, against no figure a year earlier. Shares outstanding stood at 5,565,168 at the half-year end.
Guidance is unchanged — but the reporting entity is not
Full-year FY12/2026 guidance is unchanged from the February 10, 2026 forecast: revenue of ¥2,956 million (+20.2%), operating profit of ¥640 million (+22.3%), ordinary profit of ¥641 million (+26.2%) and net profit of ¥423 million (+23.6%), for earnings per share of ¥74.22. Measured against those figures the half delivered 48.3% of the revenue guidance and 46.2% of the operating-profit guidance, so the year is guided to be slightly second-half weighted on profit. The dividend forecast is also unrevised at ¥50.56 for the year against ¥40.30 for FY12/2025, all of it at the year-end — the company pays no interim dividend, so no cash left the business at the half — which is 68.1% of the guided EPS. Note that the filing carries an explicit split note against its per-share earnings figures but none against the dividend table.
Two events that fall outside this half will shape the next one. On July 1, 2026 the company completed the purchase of 100% of GMO Digital Lab, Inc. (GMOデジタルラボ株式会社) from GMO GlobalSign Holdings, Inc. (GMOグローバルサイン・ホールディングス株式会社) — 600 shares for ¥700 million in cash, plus a contingent earn-out of up to ¥100 million tied to the target's FY12/2026 to FY12/2028 performance, for a maximum consideration of ¥800 million. The target sells smartphone-app store promotion, customer-acquisition and operational-efficiency tools to small businesses and single stores, plus corporate and local-government DX support, which the company describes as complementary to its own large-chain focus. It will be accounted for as a transaction under common control, and the company moves to consolidated reporting from that date; a separate consolidated forecast published on June 15, 2026 is also unchanged. The filing does not state that the ¥700,000 thousand of borrowings drawn during the half were raised for the acquisition, but the two amounts are identical.
Also on July 1 the company launched 「GMO店舗AIO」, a service that works to have a client's store recommended by generative-AI assistants such as ChatGPT and Gemini — the company describes it as the generative-AI equivalent of search-engine and map-engine optimisation, positions it as a priority driver of future growth, and states plainly that, because it launched on July 1, none of it is reflected in these results. An analyst and institutional-investor briefing was scheduled for August 14, 2026, the day after this filing.
| Metric | H1 FY12/2026 | H1 FY12/2025 | Change |
|---|---|---|---|
| Revenue (¥ million) | 1,427 | 1,153 | +23.8% |
| Cost of sales (¥ million) | 387 | 173 | +123.1% |
| Gross profit (¥ million) | 1,040 | 979 | +6.2% |
| SG&A expenses (¥ million) | 744 | 721 | +3.3% |
| Operating profit (¥ million) | 295 | 258 | +14.4% |
| Operating margin | 20.7% | 22.4% | −1.7 pt |
| Ordinary profit (¥ million) | 296 | 258 | +14.6% |
| Net profit (¥ million) | 206 | 172 | +20.2% |
| EPS (¥) | 37.56 | 47.85 | −21.5% |
| Customer stores | 18,191 | 17,011 | +6.9% |
| Total assets (¥ million) | 4,663 | 4,038 | +15.5% |
| Net assets (¥ million) | 2,643 | 2,776 | −4.8% |
| Equity ratio | 56.7% | 68.7% | −12.0 pt |
| Interest-bearing debt (¥ million) | 700 | — | new |
| Operating cash flow (¥ million) | 255 | 143 | +78.7% |
| FY12/2026 guidance — revenue (¥ million) | 2,956 | — | +20.2% |
| FY12/2026 guidance — operating profit (¥ million) | 640 | — | +22.3% |
| FY12/2026 guidance — ordinary profit (¥ million) | 641 | — | +26.2% |
| FY12/2026 guidance — net profit (¥ million) | 423 | — | +23.6% |
| FY12/2026 guidance — EPS (¥) | 74.22 | — | n.m. |
| Annual dividend per share (¥) | 50.56 | 40.30 | +25.5% |
JapanStockPulse provides informational content only and does not constitute investment advice. Figures are taken from the company's published earnings short report and may be subject to subsequent revision.