A record quarter for tickets, a halved quarter for profit
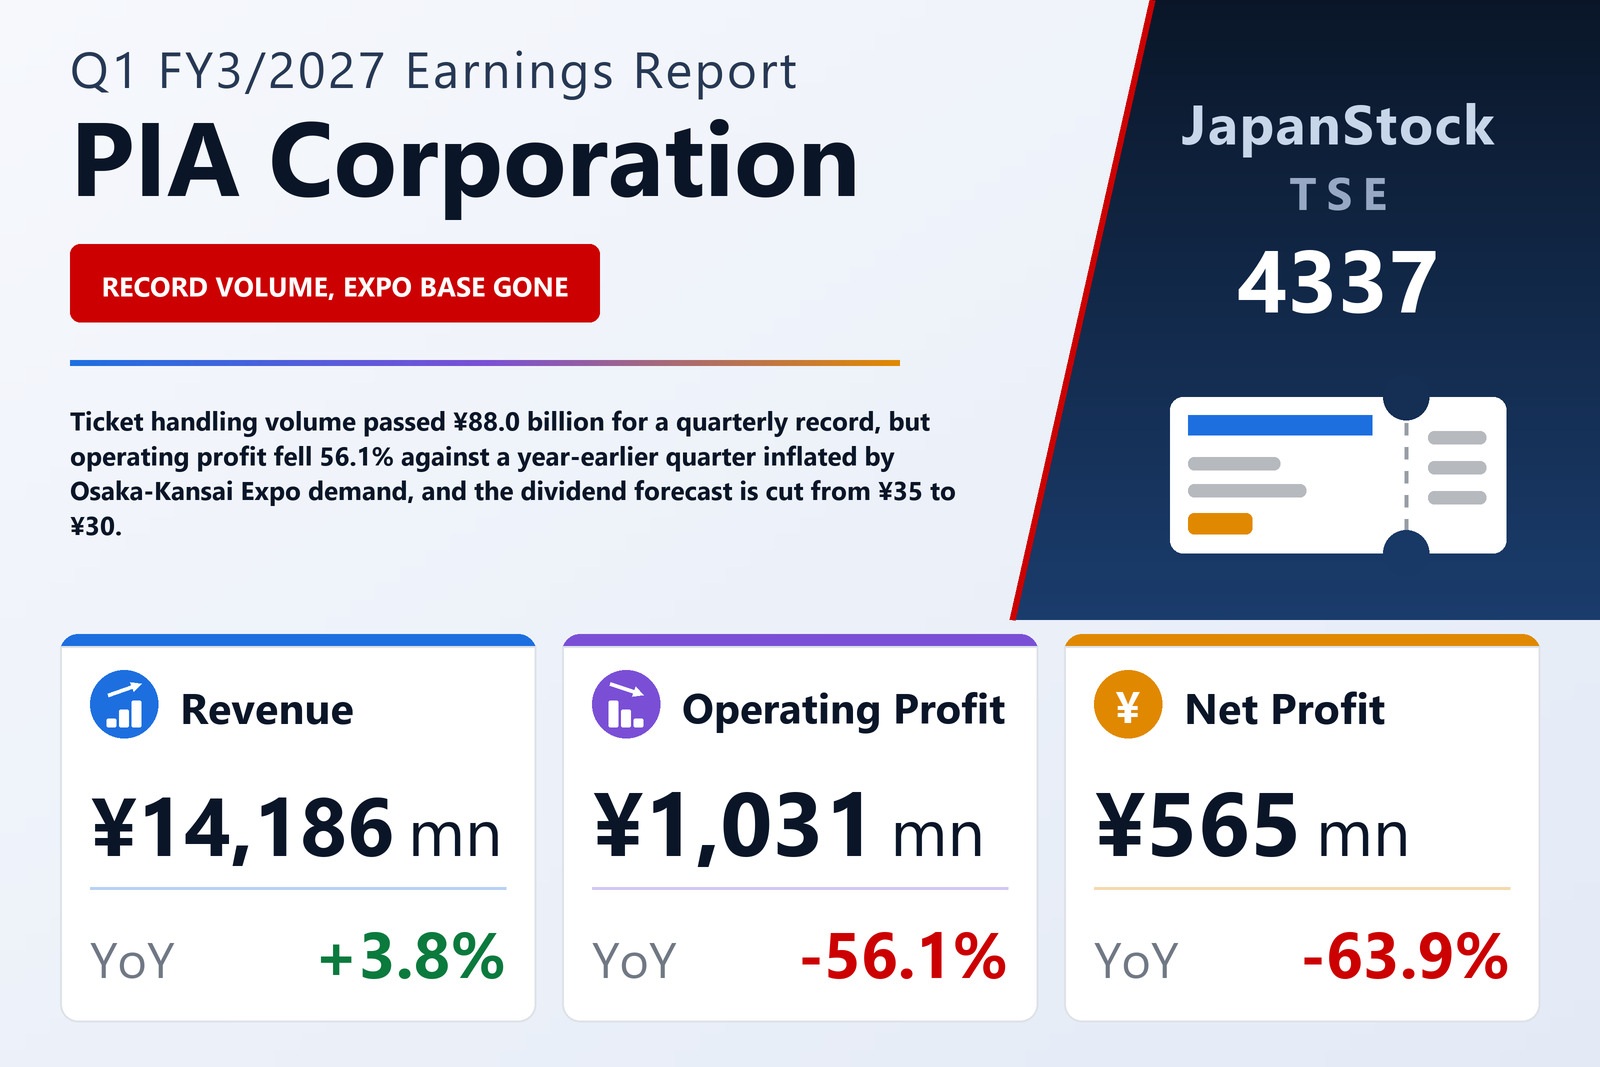
PIA Corporation (TSE: 4337), the Tokyo-based ticketing agency and entertainment-media publisher, released consolidated results for the three months to June 30, 2026 on August 13, 2026 under Japanese GAAP. Revenue rose 3.8% to ¥14,186 million, but operating profit fell 56.1% to ¥1,031 million, ordinary profit 56.8% to ¥1,023 million and profit attributable to owners of the parent 63.9% to ¥565 million, for earnings per share of ¥36.83 against ¥102.16. Comprehensive income was ¥565 million, down 63.6%. The company states the same figures the other way round, as a share of the prior-year quarter: revenue at 103.8%, operating profit at 43.8%, ordinary profit at 43.1% and attributable profit at 36.1%.
The top line and the profit line moved in opposite directions because the cost line moved faster than either. Cost of sales rose 19.7% to ¥8,962 million on 3.8% more revenue, so gross profit fell 15.5% to ¥5,224 million and the gross margin dropped from 45.2% to 36.8%, a fall of 8.4 percentage points calculated here from the two years' own figures, which the filing does not spell out. Selling, general and administrative expenses added a further 9.5%, to ¥4,192 million. That is the entire distance between a 3.8% revenue gain and a 56.1% operating-profit fall: the operating margin went from 17.2% to 7.3%. Below the operating line almost nothing moved — non-operating income of ¥87 million against ¥125 million and non-operating expense of ¥95 million against ¥105 million, including ¥88 million of interest paid — so ordinary profit tracked operating profit almost exactly.
Volume set a record; the comparison did not
Ticket handling volume, the gross value of tickets sold of which only the commission reaches revenue, exceeded ¥88.0 billion and was the highest ever for a single quarter on the company's own account. It credits large-scale performances by visiting overseas artists and national tours by domestic groups, naming pro baseball and J.League football fixtures, TREASURE, ONE OK ROCK, Mrs. GREEN APPLE, The Weeknd, FRUITS ZIPPER, NiziU, Masaharu Fukuyama (福山雅治), Mr.Children, SEKAI NO OWARI, ROCK IN JAPAN FESTIVAL and Disney On Ice, alongside media titles including Royal Host Pia (ロイヤルホストぴあ) and the Mori no Cafe to Midori no Restaurant (森のカフェと緑のレストラン) series. Nothing in the disclosure suggests the ticketing business weakened.
The profit fall is explained by exactly two items. The year-earlier quarter carried what the company calls special demand tied to the Osaka-Kansai Expo, which has now dropped out, and this year has begun booking the cost of migrating to a next-generation system. The company argues that its earning power excluding those two factors grew steadily and that the group is on plan in the first year of a new three-year medium-term programme built on establishing and expanding the business base and investing in business infrastructure. It puts no number on the Expo contribution, so how much of the shortfall each item explains cannot be checked from this document.
The base itself was exceptional, and the filing says so on its own cover: in the same quarter a year earlier operating profit had grown 253.1%, ordinary profit 265.2% and attributable profit 158.0%. Working backwards through those rates puts the April–June 2024 quarter at roughly ¥666 million of operating profit (¥2,351 million ÷ 3.531) and ¥606 million of attributable profit (¥1,564 million ÷ 2.580). On that two-year view operating profit is up about 55% and attributable profit down about 7% — a materially different picture from the headline halving, and one this filing does not draw itself.
An 8.7% equity ratio is what a ticketing balance sheet looks like
Total assets rose ¥6,509 million to ¥123,758 million while net assets rose only ¥19 million, to ¥10,772 million, so the equity ratio slipped from 9.2% to 8.7%. Read cold that number looks like distress; in this business it is structural. Most of the balance sheet is money in transit: trade payables — what PIA owes promoters and rights holders for tickets it has already sold — rose ¥6,111 million to ¥73,925 million, 59.7% of total assets on that line alone, and current liabilities of ¥96,299 million are 77.8% of the balance sheet. Facing them are cash and deposits of ¥56,500 million and receivables of ¥33,163 million, together 72.4% of assets. Interest-bearing debt is modest by comparison: long-term borrowings of ¥14,545 million, down ¥254 million, plus ¥1,015 million falling due within a year. There is no going-concern note.
The rest of the movement is ordinary quarterly plumbing. Income taxes payable fell from ¥1,587 million to ¥486 million and the bonus provision from ¥895 million to ¥20 million as both were paid out; retained earnings rose just ¥18 million, the ¥565 million of quarterly profit almost exactly offset by the dividend paid. The line worth watching is software in progress, up ¥1,134 million to ¥4,379 million, with completed software down ¥303 million to ¥3,200 million — the next-generation system is being built and capitalised, while its migration cost runs through the income statement. Depreciation for the quarter was ¥569 million against ¥627 million. No quarterly cash flow statement was prepared, and the statements were not reviewed by an accounting auditor.
Guidance says the year shrinks; the quarter grew
Full-year FY3/2027 guidance is unchanged from the figures published on May 14, 2026: revenue of ¥48,000 million, down 13.2%, operating profit of ¥2,500 million (−42.0%), ordinary profit of ¥2,300 million (−47.1%) and attributable profit of ¥1,500 million (−54.8%), for earnings per share of ¥97.70. The quarter sits awkwardly inside that. Revenue grew 3.8% where the year is guided to fall 13.2%, and the ¥14,186 million already booked is 29.6% of the full-year revenue target, while ¥565 million of attributable profit is 37.7% of the ¥1,500 million full-year figure and ¥1,031 million of operating profit is 41.2% of ¥2,500 million. One quarter of the year is therefore ahead of a straight-line share on every profit line. The filing offers no reconciliation: its entire comment on the outlook is that there is no change to the May 14 numbers, so whether the guidance embeds a specific second-half step-down or is simply being left alone this early cannot be told from this document.
The dividend is being cut. FY3/2027 is forecast at ¥30.00 per share, all of it at the year-end with no interim payment, against ¥35.00 paid for FY3/2026 on the same year-end-only pattern — a reduction of 14.3%, and itself unchanged from the company's previous dividend forecast. Against guided earnings per share of ¥97.70 that is a payout of roughly 31%, and no payment start date is given. There is no segment breakdown to read: PIA reports a single business, Leisure and Entertainment-related, and states that its other segments are immaterial, so the segment note is omitted for both quarters. Shares issued were 15,668,713 with 321,825 held in treasury, and the per-share figures use a weighted average of 15,346,889 shares.
| Metric | Q1 FY3/2027 | Q1 FY3/2026 | Change |
|---|---|---|---|
| Revenue (¥ million) | 14,186 | 13,667 | +3.8% |
| Cost of sales (¥ million) | 8,962 | 7,485 | +19.7% |
| Gross profit (¥ million) | 5,224 | 6,181 | −15.5% |
| Gross margin | 36.8% | 45.2% | −8.4 pt |
| SG&A expenses (¥ million) | 4,192 | 3,830 | +9.5% |
| Operating profit (¥ million) | 1,031 | 2,351 | −56.1% |
| Operating margin | 7.3% | 17.2% | −9.9 pt |
| Ordinary profit (¥ million) | 1,023 | 2,371 | −56.8% |
| Net profit attrib. to owners of parent (¥ million) | 565 | 1,564 | −63.9% |
| Comprehensive income (¥ million) | 565 | 1,552 | −63.6% |
| EPS (¥) | 36.83 | 102.16 | −63.9% |
| Cash and deposits (¥ million) | 56,500 | 54,749 | +3.2% |
| Trade payables (¥ million) | 73,925 | 67,814 | +9.0% |
| Current liabilities (¥ million) | 96,299 | 89,564 | +7.5% |
| Total assets (¥ million) | 123,758 | 117,249 | +5.6% |
| Net assets (¥ million) | 10,772 | 10,753 | +0.2% |
| Shareholders' equity (¥ million) | 10,768 | 10,749 | +0.2% |
| Equity ratio | 8.7% | 9.2% | −0.5 pt |
| FY3/2027 guidance — revenue (¥ million) | 48,000 | — | −13.2% |
| FY3/2027 guidance — operating profit (¥ million) | 2,500 | — | −42.0% |
| FY3/2027 guidance — ordinary profit (¥ million) | 2,300 | — | −47.1% |
| FY3/2027 guidance — net profit (¥ million) | 1,500 | — | −54.8% |
| FY3/2027 guidance — EPS (¥) | 97.70 | — | n.m. |
| Annual dividend per share (¥) | 30.00 | 35.00 | −14.3% |
JapanStockPulse provides informational content only and does not constitute investment advice. Figures are taken from the company's published earnings short report and may be subject to subsequent revision.