Revenue barely moved, and one line did all the work
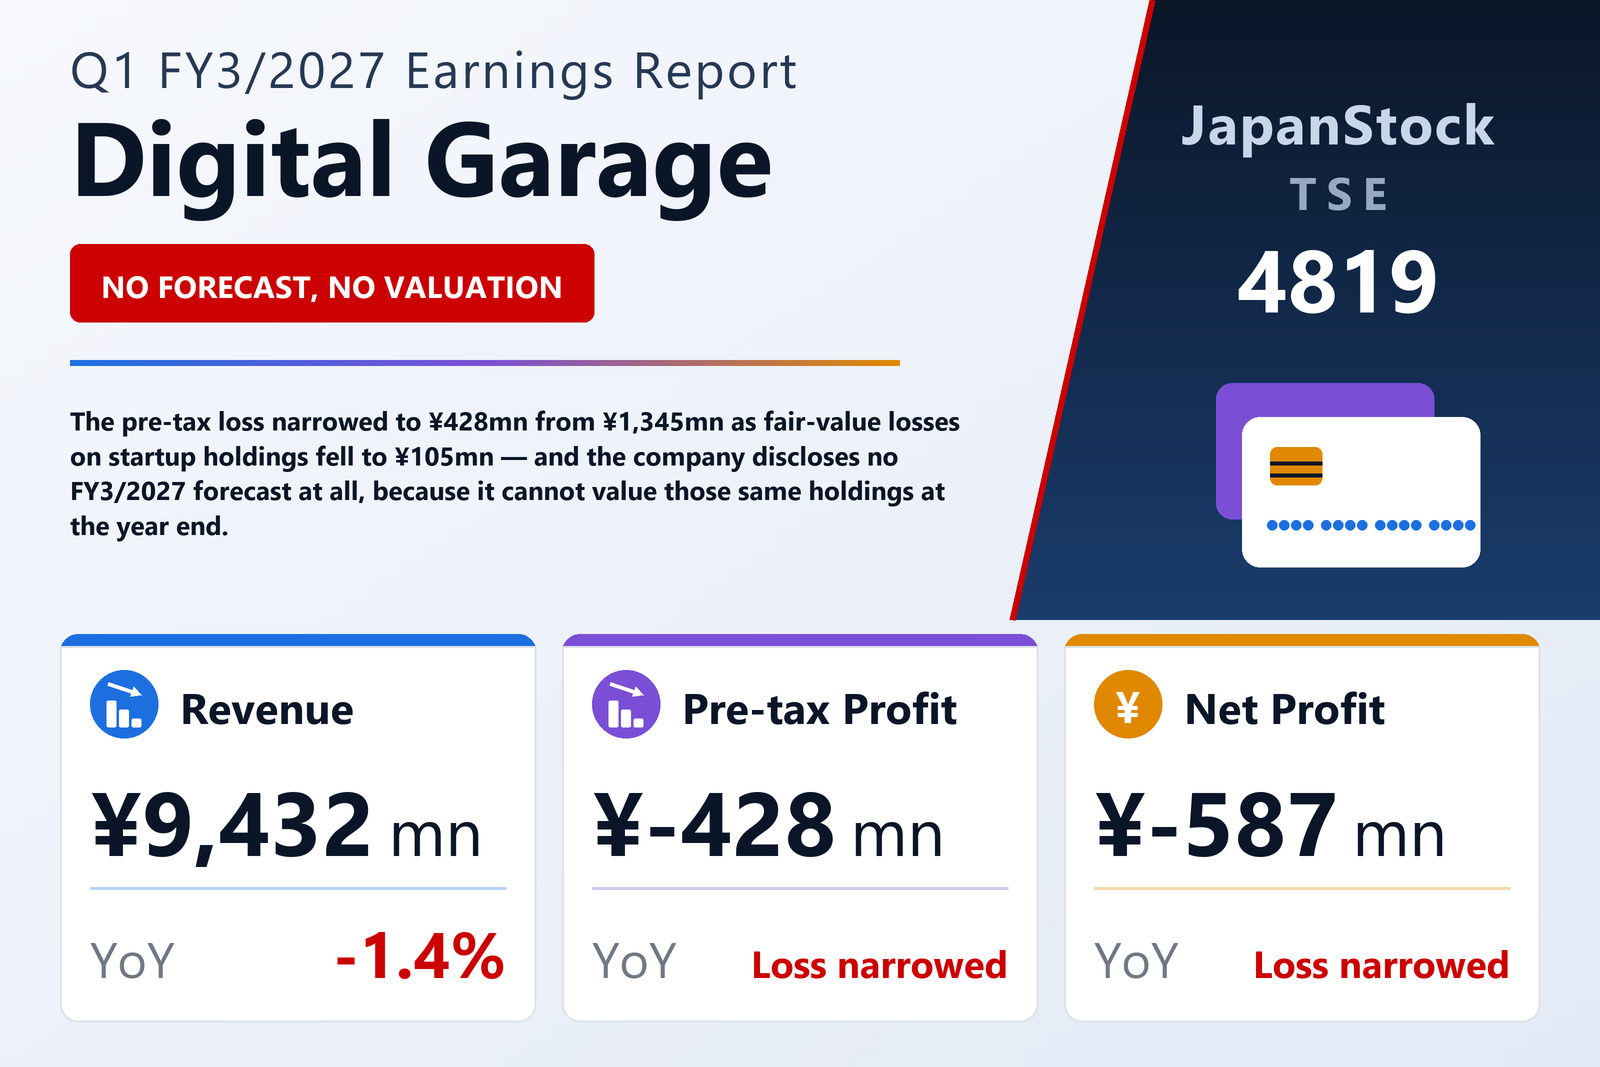
Digital Garage, Inc. (TSE: 4819), the Tokyo group that runs a comprehensive electronic-payment platform alongside a business-incubation arm and a startup investment portfolio, published consolidated results for the three months to June 30, 2026 on August 13, 2026 under IFRS, with figures rounded to the nearest million yen. Revenue fell 1.4% to ¥9,432 million. The pre-tax loss narrowed to ¥428 million from ¥1,345 million, the quarterly loss to ¥592 million from ¥759 million, and the loss attributable to owners of the parent to ¥587 million from ¥673 million, for a basic and diluted loss per share of ¥12.75 against ¥14.69. Total comprehensive income was −¥321 million against −¥1,000 million. The quarterly financial statements were not reviewed by a certified public accountant or an audit firm.
The ¥917 million improvement in the pre-tax result is not spread across the income statement; it is concentrated in a single expense line. The net loss on operational investment securities fell to ¥105 million from ¥1,866 million — a ¥1,761 million swing that is on its own nearly twice the whole improvement. Almost everything else went the other way. Selling, general and administrative expenses rose 7.9% to ¥6,054 million, cost of sales rose to ¥3,293 million from ¥3,137 million, other expenses rose to ¥178 million from ¥78 million, and the share of profit of equity-method investees — which this group reports inside revenue, not below it — fell 30.1% to ¥602 million. Recurring-business revenue itself grew 1.7%, to ¥8,481 million from ¥8,342 million. Below the pre-tax line the direction reverses again: income tax was a ¥163 million expense against a ¥586 million credit a year earlier, which is why the loss attributable to owners barely moved — ¥587 million against ¥673 million — while the pre-tax loss narrowed by ¥917 million.
Payment volume grew 41.3%; payment revenue grew ¥3 million
The Platform Solution segment, the payment business, lifted revenue 2.3% to ¥6,037 million but saw its pre-tax profit fall 11.9% to ¥1,942 million. Volume and revenue tell opposite stories here. Payment transaction value rose 41.3% to ¥2.9 trillion, which the company credits to its Cloud Pay common QR-code payment solution and to a large KDDI Group project going live. Yet the revenue-disaggregation note puts the payment business's own recurring revenue at ¥4,617 million against ¥4,614 million — a gain of ¥3 million. Payment agency revenue is recognised net of the fees passed on to card companies and other payment providers, so transaction value does not convert into revenue one-for-one; the company additionally points to cancellations and contract revisions at some large merchants during the previous financial year, and to higher fixed costs from reinforcing its systems. The segment's growth came from elsewhere: financial marketing revenue rose 11.4% to ¥1,306 million.
The two incubation segments moved in opposite directions
Long-Term Incubation, which builds new businesses around the group's payment platform and the customer assets of Kakaku.com, Inc., reported revenue down 1.9% to ¥3,291 million but pre-tax profit up 43.2% to ¥895 million. Its own equity-method income fell, to ¥966 million from ¥1,020 million, and commerce-marketing revenue fell to ¥1,257 million from ¥1,412 million; what carried the segment was ¥694 million of other recurring revenue, up from ¥504 million, from strategic new businesses the company describes as still in a growth phase. Global Investment Incubation, the startup investment arm, reported negative revenue of ¥252 million against negative ¥100 million, because the equity-method line inside its revenue was −¥442 million against −¥234 million; its pre-tax loss narrowed to ¥952 million from ¥2,617 million. The segment note states explicitly that this result carries the net loss on operational investment securities — ¥105 million this quarter, ¥1,866 million a year ago — so the group improvement and the segment improvement are the same event, counted once. Unallocated items were a heavier drag: the reconciliation to the consolidated pre-tax loss was −¥2,314 million against −¥1,559 million, as corporate expenses not attributed to any segment rose to ¥3,421 million from ¥2,660 million.
A ¥62.6 billion Level 3 book, and no forecast because of it
Digital Garage is disclosing no consolidated forecast for FY3/2027 at all. Its stated reason is that it is difficult to reasonably estimate the fair value at the year end of the securities it holds in startups and similar companies. The attachment goes further: the Platform Solution segment forecast is also withheld, because the group is formulating a new medium-term management plan that includes a review of its business portfolio, which it expects to announce during FY3/2027. The scale behind that caution sits in the financial-instruments note. Of ¥65,565 million of financial assets carried at fair value at June 30, 2026, ¥62,612 million is Level 3 — measured on inputs for which market data is scarce or absent — against just ¥2,954 million of Level 1. That Level 3 book equals 29.4% of the group's ¥213,121 million of total assets. Where a recent arm's-length transaction or financing price is unavailable, the company values a holding on an adjusted transaction price or on the investee's balance-sheet net assets, using adjustment multiples that ranged from 0.1 times to 1.5 times in both periods. Unrealised losses on instruments still held at the period end were ¥542 million, against ¥1,989 million a year earlier. On the same reasoning the FY3/2027 dividend forecast is undetermined: FY3/2026 paid ¥47.00 per share, all of it at the year end, and the company states there has been no revision to any previously announced dividend forecast.
Cash generation improved sharply as the balance sheet shrank
Operating cash flow was positive ¥5,870 million against positive ¥287 million a year earlier, almost entirely a working-capital effect inside the payment business: trade and other receivables released ¥5,689 million while trade and other payables absorbed only ¥1,670 million, where a year ago payables absorbed ¥6,995 million. Investing used ¥2,051 million, mostly the ¥1,481 million spent on intangible assets, and financing used ¥3,483 million, including ¥2,140 million of dividends paid and ¥1,700 million of long-term borrowings repaid against ¥294 million received from non-controlling interests. Cash and equivalents closed at ¥40,805 million, up ¥336 million. Total assets fell 2.6% to ¥213,121 million, which the company attributes chiefly to a ¥5,902 million decline in payment-business receivables; liabilities fell 2.5% to ¥137,543 million; and equity fell 2.7% to ¥75,578 million as retained earnings absorbed ¥2,158 million of dividends and the ¥587 million loss. Equity attributable to owners of the parent was ¥73,006 million and the ratio of equity attributable to owners eased to 34.3% from 34.6%. Shares issued rose to 47,888,274 from 47,714,532 and treasury shares fell to 1,777,033 from 1,789,265, leaving a weighted average of 46,004,099 shares for the quarter.
| Metric | Q1 FY3/2027 | Q1 FY3/2026 | Change |
|---|---|---|---|
| Revenue (¥ million) | 9,432 | 9,569 | −1.4% |
| Recurring-business revenue (¥ million) | 8,481 | 8,342 | +1.7% |
| Share of profit of equity-method investees (¥ million) | 602 | 861 | −30.1% |
| Net loss on operational investment securities (¥ million) | 105 | 1,866 | loss narrowed |
| SG&A expenses (¥ million) | 6,054 | 5,613 | +7.9% |
| Pre-tax profit (¥ million) | −428 | −1,345 | loss narrowed |
| Income tax expense (credit in prior year) (¥ million) | 163 | −586 | n.m. |
| Net profit (¥ million) | −592 | −759 | loss narrowed |
| Net profit attrib. to owners of parent (¥ million) | −587 | −673 | loss narrowed |
| Comprehensive income (¥ million) | −321 | −1,000 | loss narrowed |
| EPS (¥) | −12.75 | −14.69 | loss narrowed |
| Platform Solution — revenue (¥ million) | 6,037 | 5,899 | +2.3% |
| Platform Solution — segment profit (¥ million) | 1,942 | 2,205 | −11.9% |
| Long-Term Incubation — revenue (¥ million) | 3,291 | 3,356 | −1.9% |
| Long-Term Incubation — segment profit (¥ million) | 895 | 625 | +43.2% |
| Global Investment Incubation — revenue (¥ million) | −252 | −100 | n.m. |
| Global Investment Incubation — segment profit (¥ million) | −952 | −2,617 | loss narrowed |
| Total assets (¥ million) | 213,121 | 218,703 | −2.6% |
| Operational investment securities (¥ million) | 52,780 | 53,505 | −1.4% |
| Financial assets at fair value — Level 3 (¥ million) | 62,612 | 63,198 | −0.9% |
| Net assets (¥ million) | 75,578 | 77,696 | −2.7% |
| Equity attrib. to owners of parent (¥ million) | 73,006 | 75,584 | −3.4% |
| Equity ratio | 34.3% | 34.6% | −0.3 pt |
JapanStockPulse provides informational content only and does not constitute investment advice. Figures are taken from the company's published earnings short report and may be subject to subsequent revision.